COMSOL 6.3 replication

Fifty years in the Johansen formation

Terra reproduces the solved COMSOL model on the exported Johansen node set: 15 kg/s of CO2 for 25 years, followed by 25 years of shut-in. The comparison tracks pressure, saturation, plume volume and the full gas-mass ledger.

3-D heterogeneous aquifer 21 output times 25 years injection + 25 years shut-in COMSOL grid comparison
Result at a glance

Global agreement is close; local front differences remain visible

The corrected 50-year run closes the mass ledger and follows the COMSOL plume volume. Saturation errors are concentrated around the moving front, so this page reports both global and pointwise measures.

+0.71%saturation-weighted CO2 volume versus COMSOL at 50 years
10.18 kPaliquid-pressure RMS difference at 50 years
0.062CO2 saturation RMS difference at 50 years
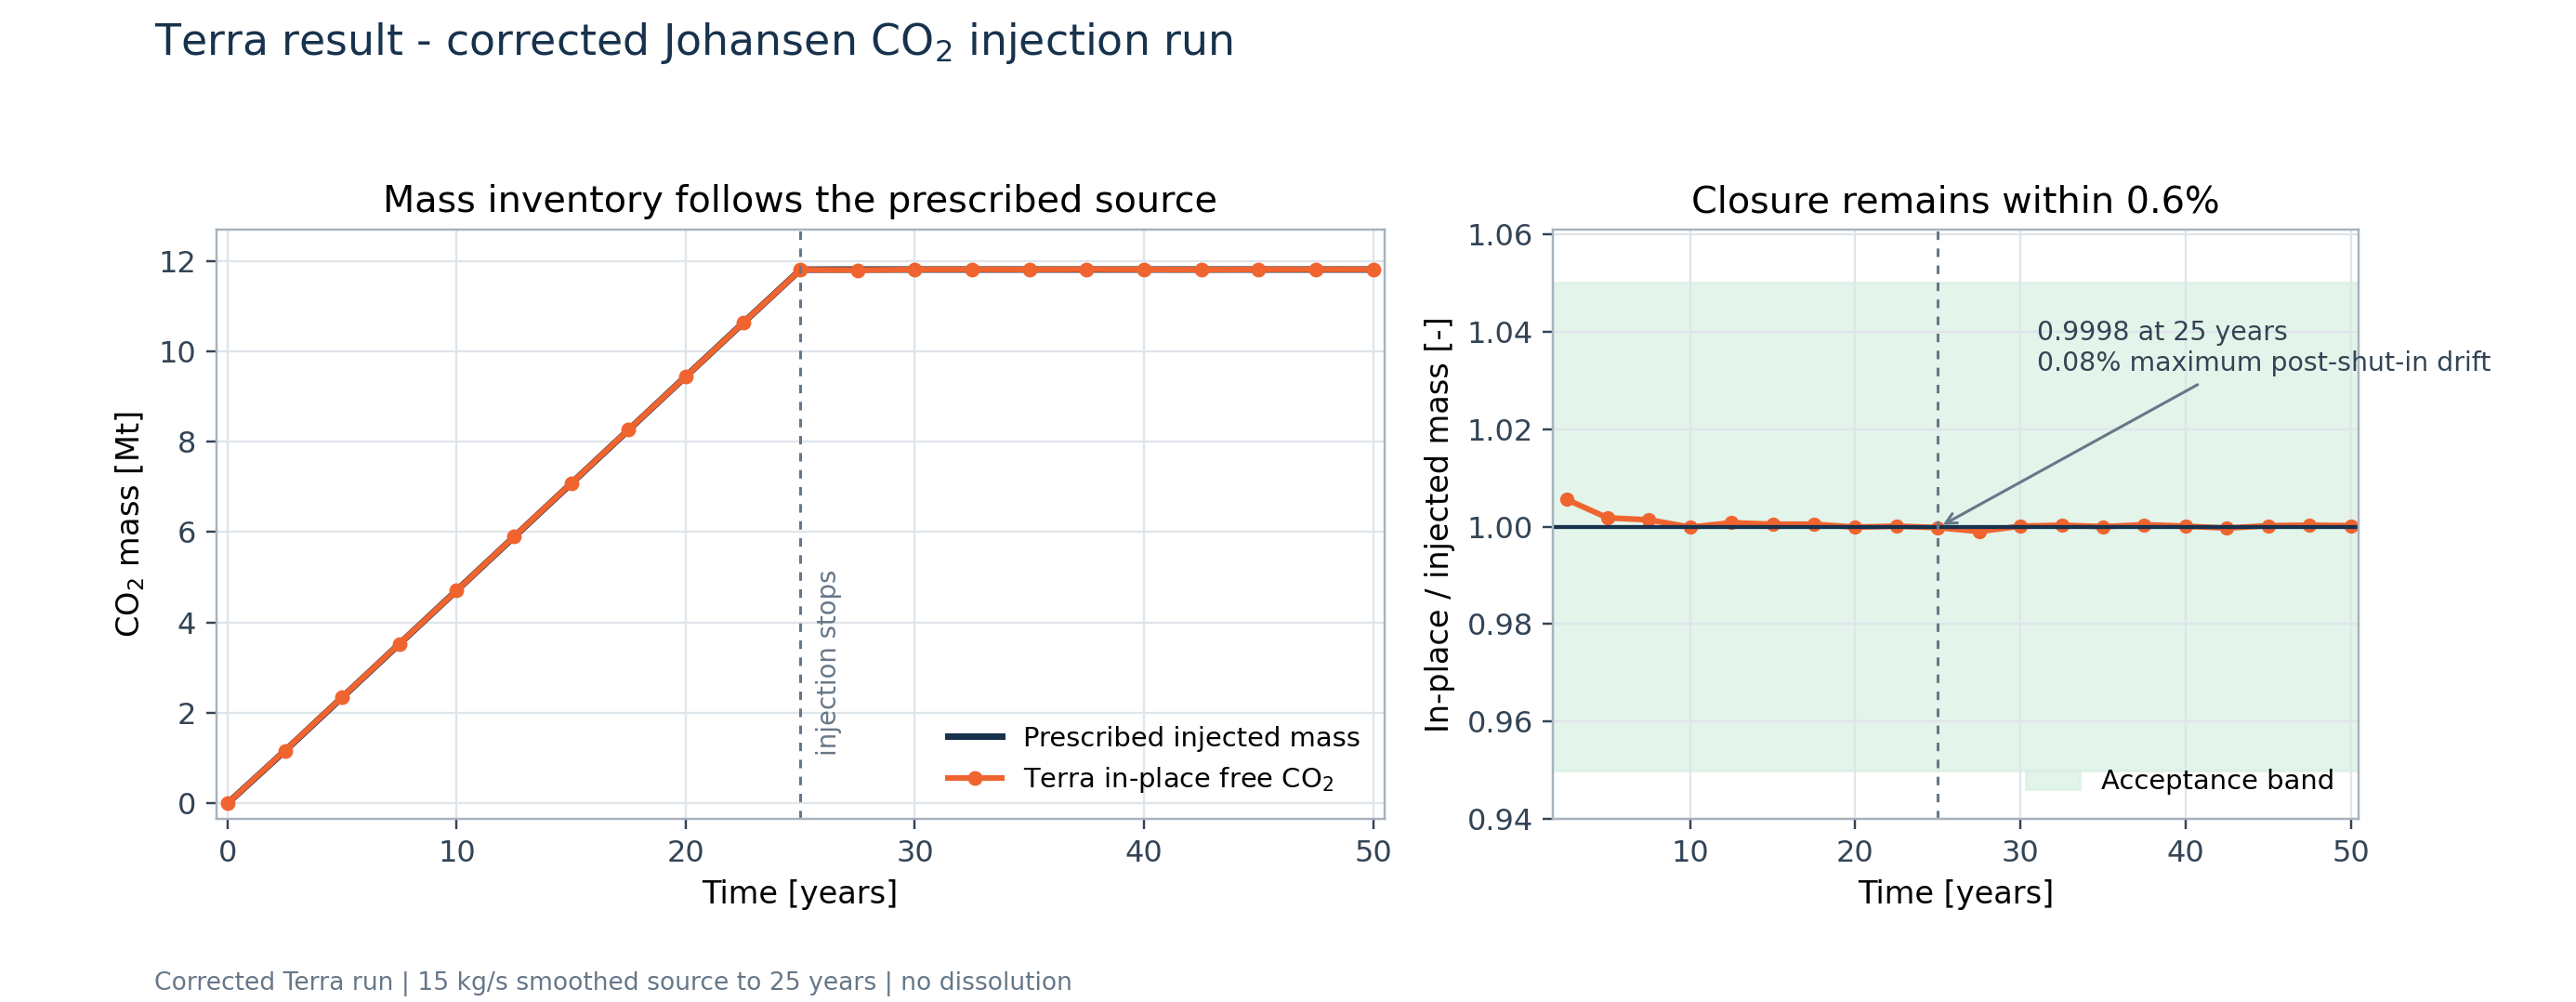
0.08%maximum in-place mass drift after shut-in
Original COMSOL PDF figure

Figures extracted from the two supplied COMSOL 6.3 manuals.

New Terra result

Plots generated from the corrected Terra run and the solved COMSOL reference exports.

Model definition

A sloping saline formation with spatially varying rock properties

The simulated Johansen subset spans roughly 9,600 m by 8,900 m. Its thickness varies from about 90 m to 140 m, and the well intersects the formation at x = 5,440 m and y = 3,300 m.

Physics and assumptions

  • Two-phase flow of brine and supercritical CO2, with gravity acting on both phases.
  • CO2 dissolution into brine is omitted, matching the COMSOL example.
  • Temperature is prescribed by a fixed geothermal gradient of 0.030 K/m, with 100 °C at 3,000 m depth. No energy equation is solved.
  • CO2 density follows Peng–Robinson. The COMSOL source uses Brokaw viscosity with a high-pressure correction; Terra's fitted viscosity law stays within 0.40% of the exported table over the solved state band.
  • Brine viscosity comes from the COMSOL Water material. Brine density varies with pressure and temperature.
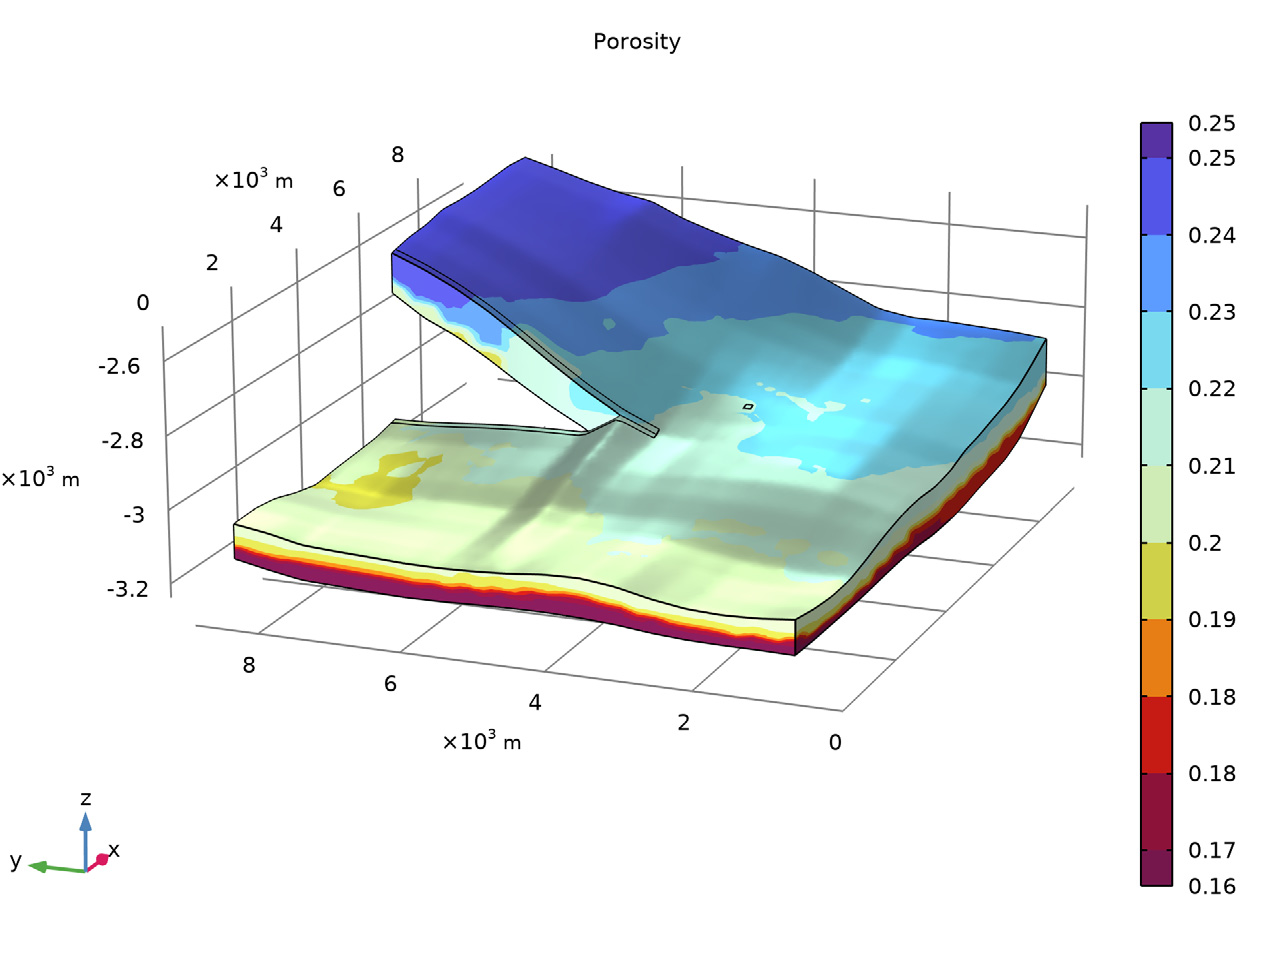
Porosity0.16–0.25
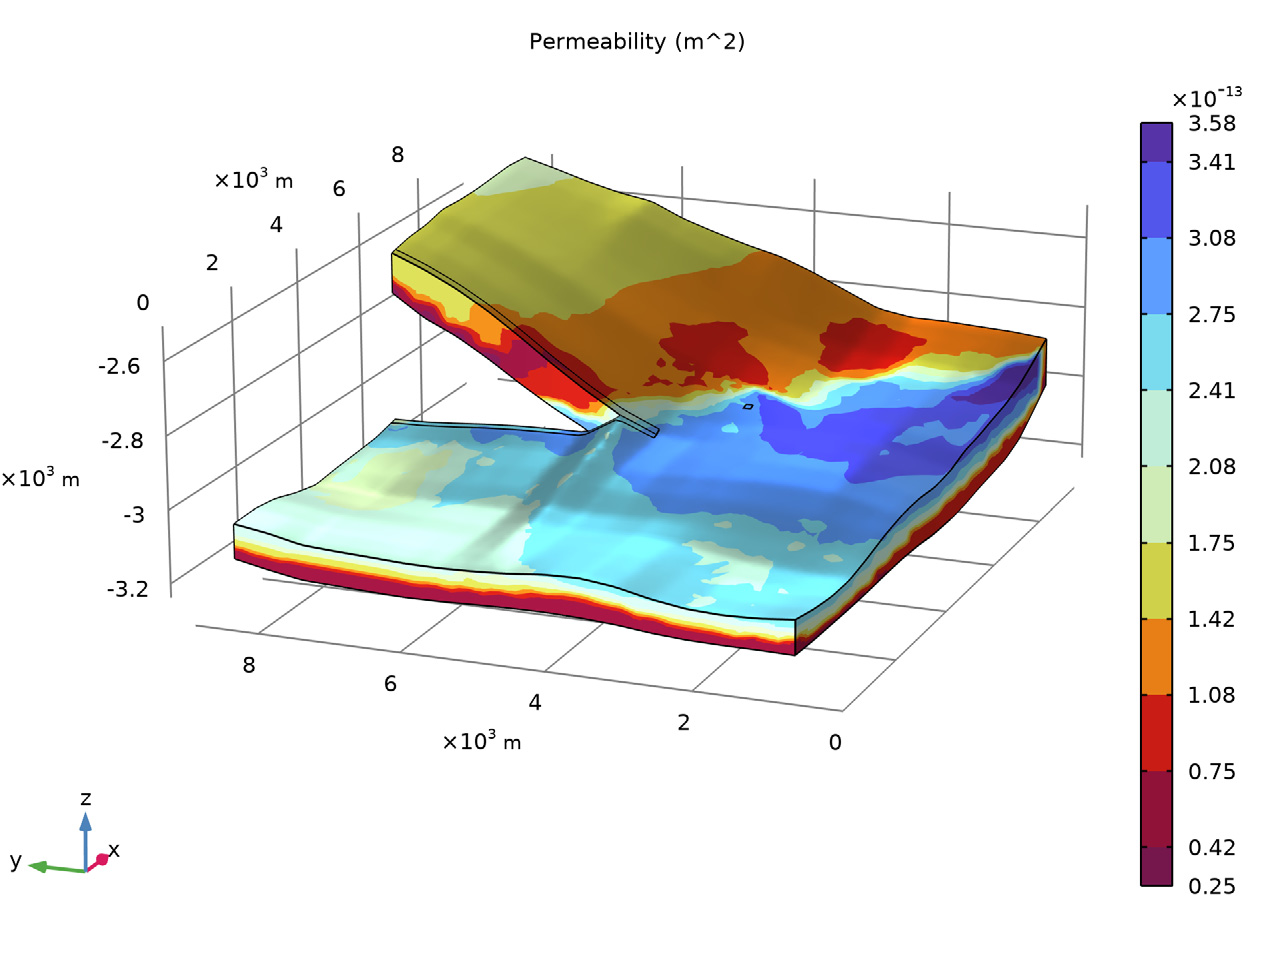
Permeability26–364 mD
COMSOL vertices61,083
Terra tetrahedra320,943
Constitutive inputs

  • Residual brine saturation: 0.2
  • Residual CO2 saturation: 0
  • Brooks–Corey entry pressure: 10 kPa
  • Brooks–Corey parameter: 2.0
  • Relative permeabilities: kr,brine = sbrine2 and kr,CO2 = sCO22
  • Brine reference density: 1,040 kg/m3 at 360 K and 100 kPa

The PDF groups capillary pressure and relative permeability under Brooks–Corey. The solved COMSOL 6.3 model applies Brooks–Corey to capillary pressure and retains kr,i = si2. Terra follows the solved model.

The porosity and permeability fields come from the 54,756-point Johansen property cloud. Terra evaluates the same cloud at element centroids.

Initial and boundary conditions for the Johansen CO2 storage model
ConditionLocation or intervalApplied valuePhysical role
Initial liquid stateWhole formationBrine filled; hydraulic head H = 0 mHydrostatic pressure with depth
Initial CO2Whole formationSaturation = 0No free CO2 before injection
Open side boundariesNine boundaries in the COMSOL “Sides” selectionH = 0 m; CO2 saturation = 0Maintains the far-field hydrostatic state
Sealed facesTop, bottom and remaining lateral fault facesNo phase flowConfines flow across caprock, base and sealed faults
InjectionWell edge; first 25 years15 kg/s with a short smoothed startIntroduces supercritical CO2
Shut-inWell edge; years 25–500 kg/sTracks gravity and capillary redistribution
Output schedule0–50 yearsEvery 2.5 years21 comparison frames
Supplied COMSOL sources

The complete scientific figure set from both manuals

The Liquid & Gas Properties and Subsurface Flow PDF editions document the same COMSOL 6.3 simulation. Their four embedded scientific figures are byte-for-byte identical; only the Application Library path and module wording differ. The atlas below includes every unique figure and keeps the original source separate from the Terra plots.

LGP manual

Liquid & Gas Properties Module

models.lgp.carbon_dioxide_storage.pdf
Liquid_and_Gas_Properties_Module/Tutorials/carbon_dioxide_storage

SSF manual

Subsurface Flow Module

models.ssf.carbon_dioxide_storage.pdf
Subsurface_Flow_Module/Fluid_Flow/carbon_dioxide_storage

Original COMSOL figure 1 - LGP + SSF, p. 3COMSOL three-dimensional porosity distribution in the selected Johansen formation
Porosity. The source figure shows the heterogeneous Johansen property field used by both manuals, with values from 0.16 to 0.25.
Original COMSOL figure 2 - LGP + SSF, p. 4COMSOL three-dimensional permeability distribution in the selected Johansen formation
Permeability. The source figure shows the same heterogeneous reservoir in square metres, spanning approximately 2.6×10⁻¹⁴ to 3.6×10⁻¹³ m2.
Original COMSOL figure 3 - LGP + SSF, p. 5COMSOL carbon dioxide saturation after 25 years of injection in the Johansen formation
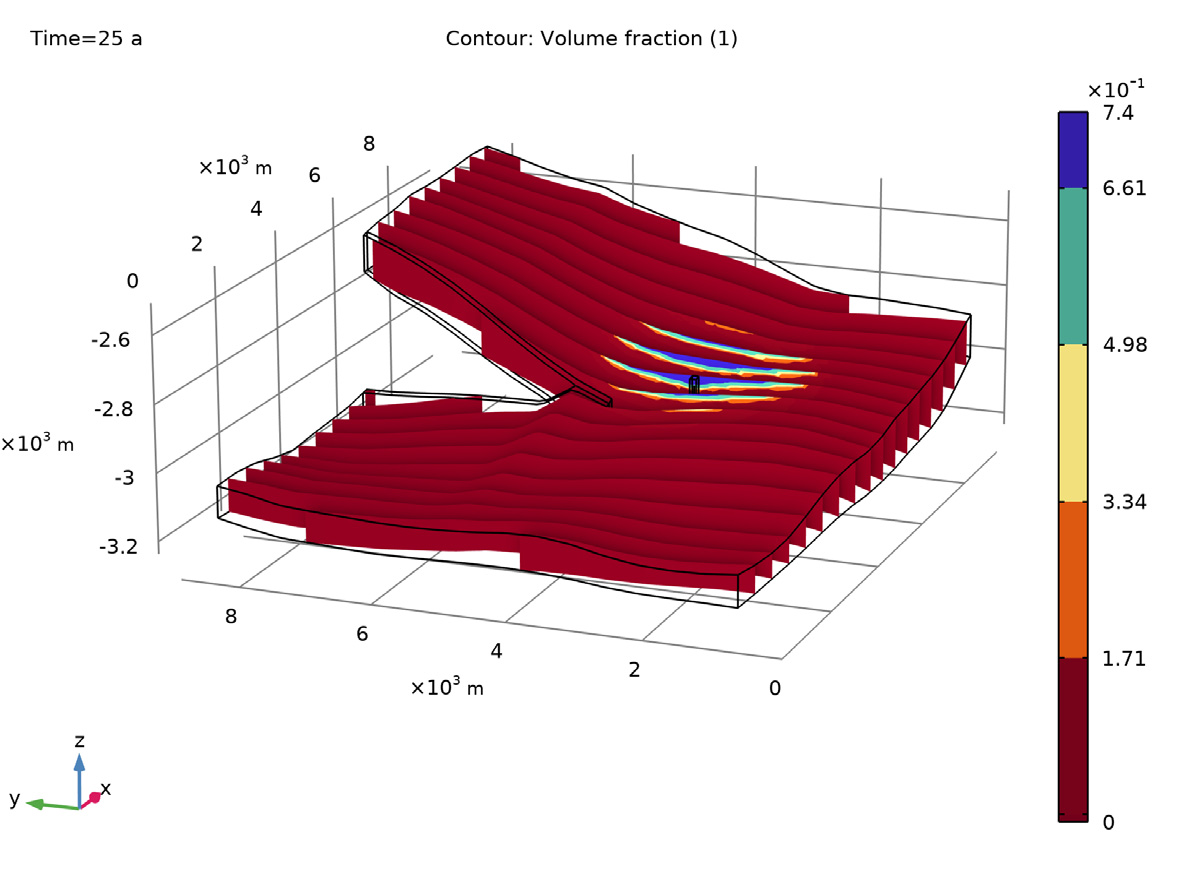
CO2 saturation after 25 years. The three-dimensional source view marks the end of injection. Buoyancy has already carried CO2 toward the top of the formation.
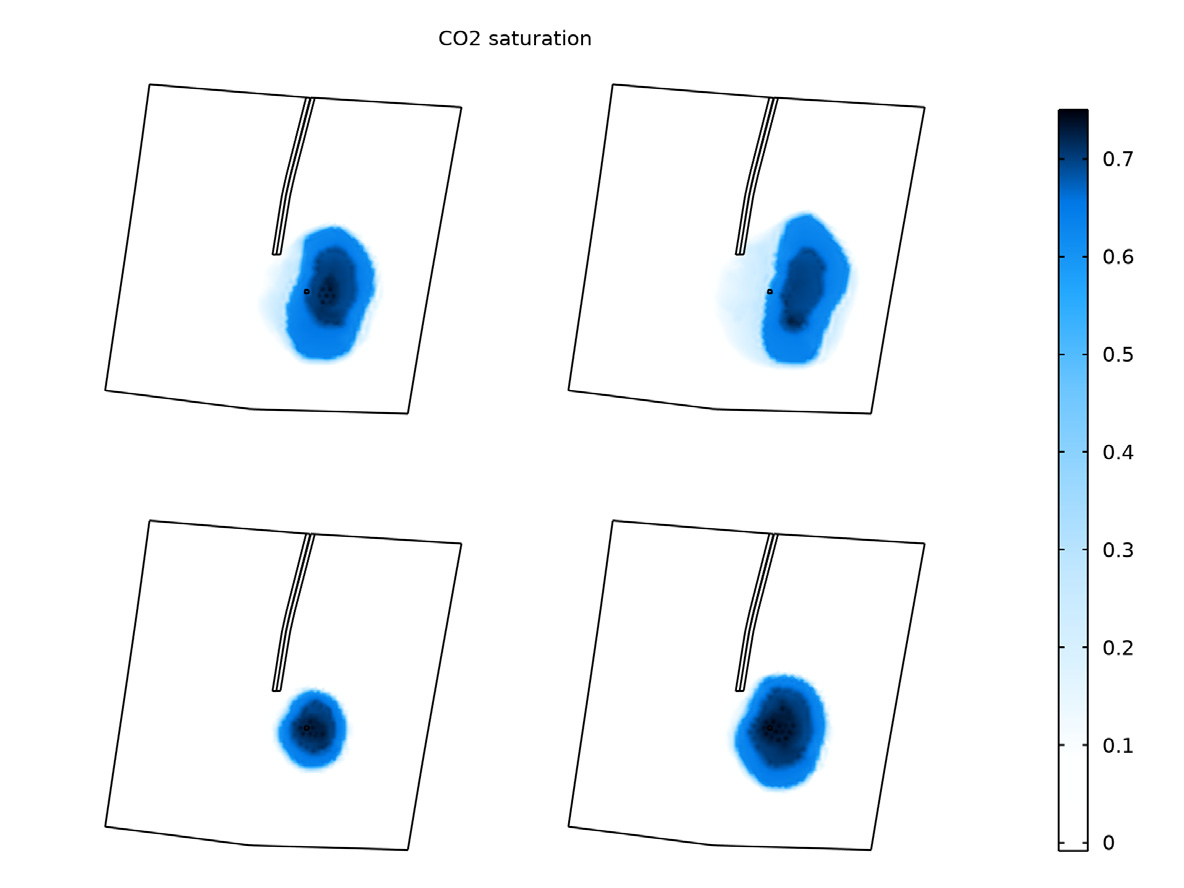
Original COMSOL figure 4 - LGP + SSF, p. 5Four COMSOL top views of carbon dioxide saturation at 12.5, 25, 37.5 and 50 years
Top-view time sequence. The panels show 12.5 years at bottom left, 25 years at bottom right, 37.5 years at top left and 50 years at top right. After shut-in, the plume continues to spread and shifts up-dip.

Completeness note: the four images above are the full scientific figure set in each supplied PDF. Showing one copy avoids presenting identical images as separate simulations. The older COMSOL 6.0 PDF in the source package repeats the same four subjects with a legacy colour scale. A modeling-instructions sentence in the 6.3 PDFs says “subcritical”; the model definition, property law and reservoir state are supercritical, which is the wording used here.

New Terra results

One comparison grid, four checks

Terra fields are evaluated on the COMSOL reference grid. Shared axes, units and colour limits make the agreement and the remaining differences visible without rescaling either result.

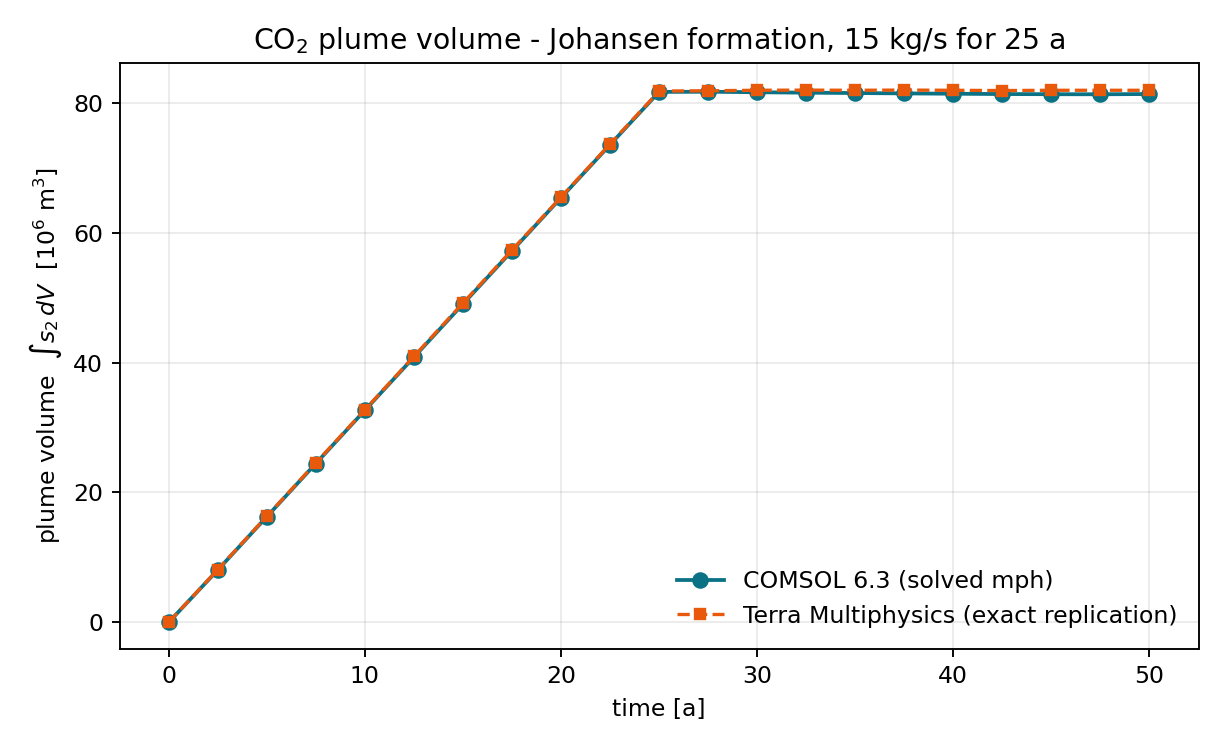
New Terra/COMSOL comparisonTerra and COMSOL carbon dioxide plume volume over fifty years, including injection and shut-in
Saturation-weighted free-gas volume, ∫sCO2 dV, through injection and shut-in. At 25 years, Terra gives 8.182×10⁷ m3 and COMSOL gives 8.168×10⁷ m3. At 50 years, the values are 8.194×10⁷ and 8.136×10⁷ m3, a +0.71% difference.
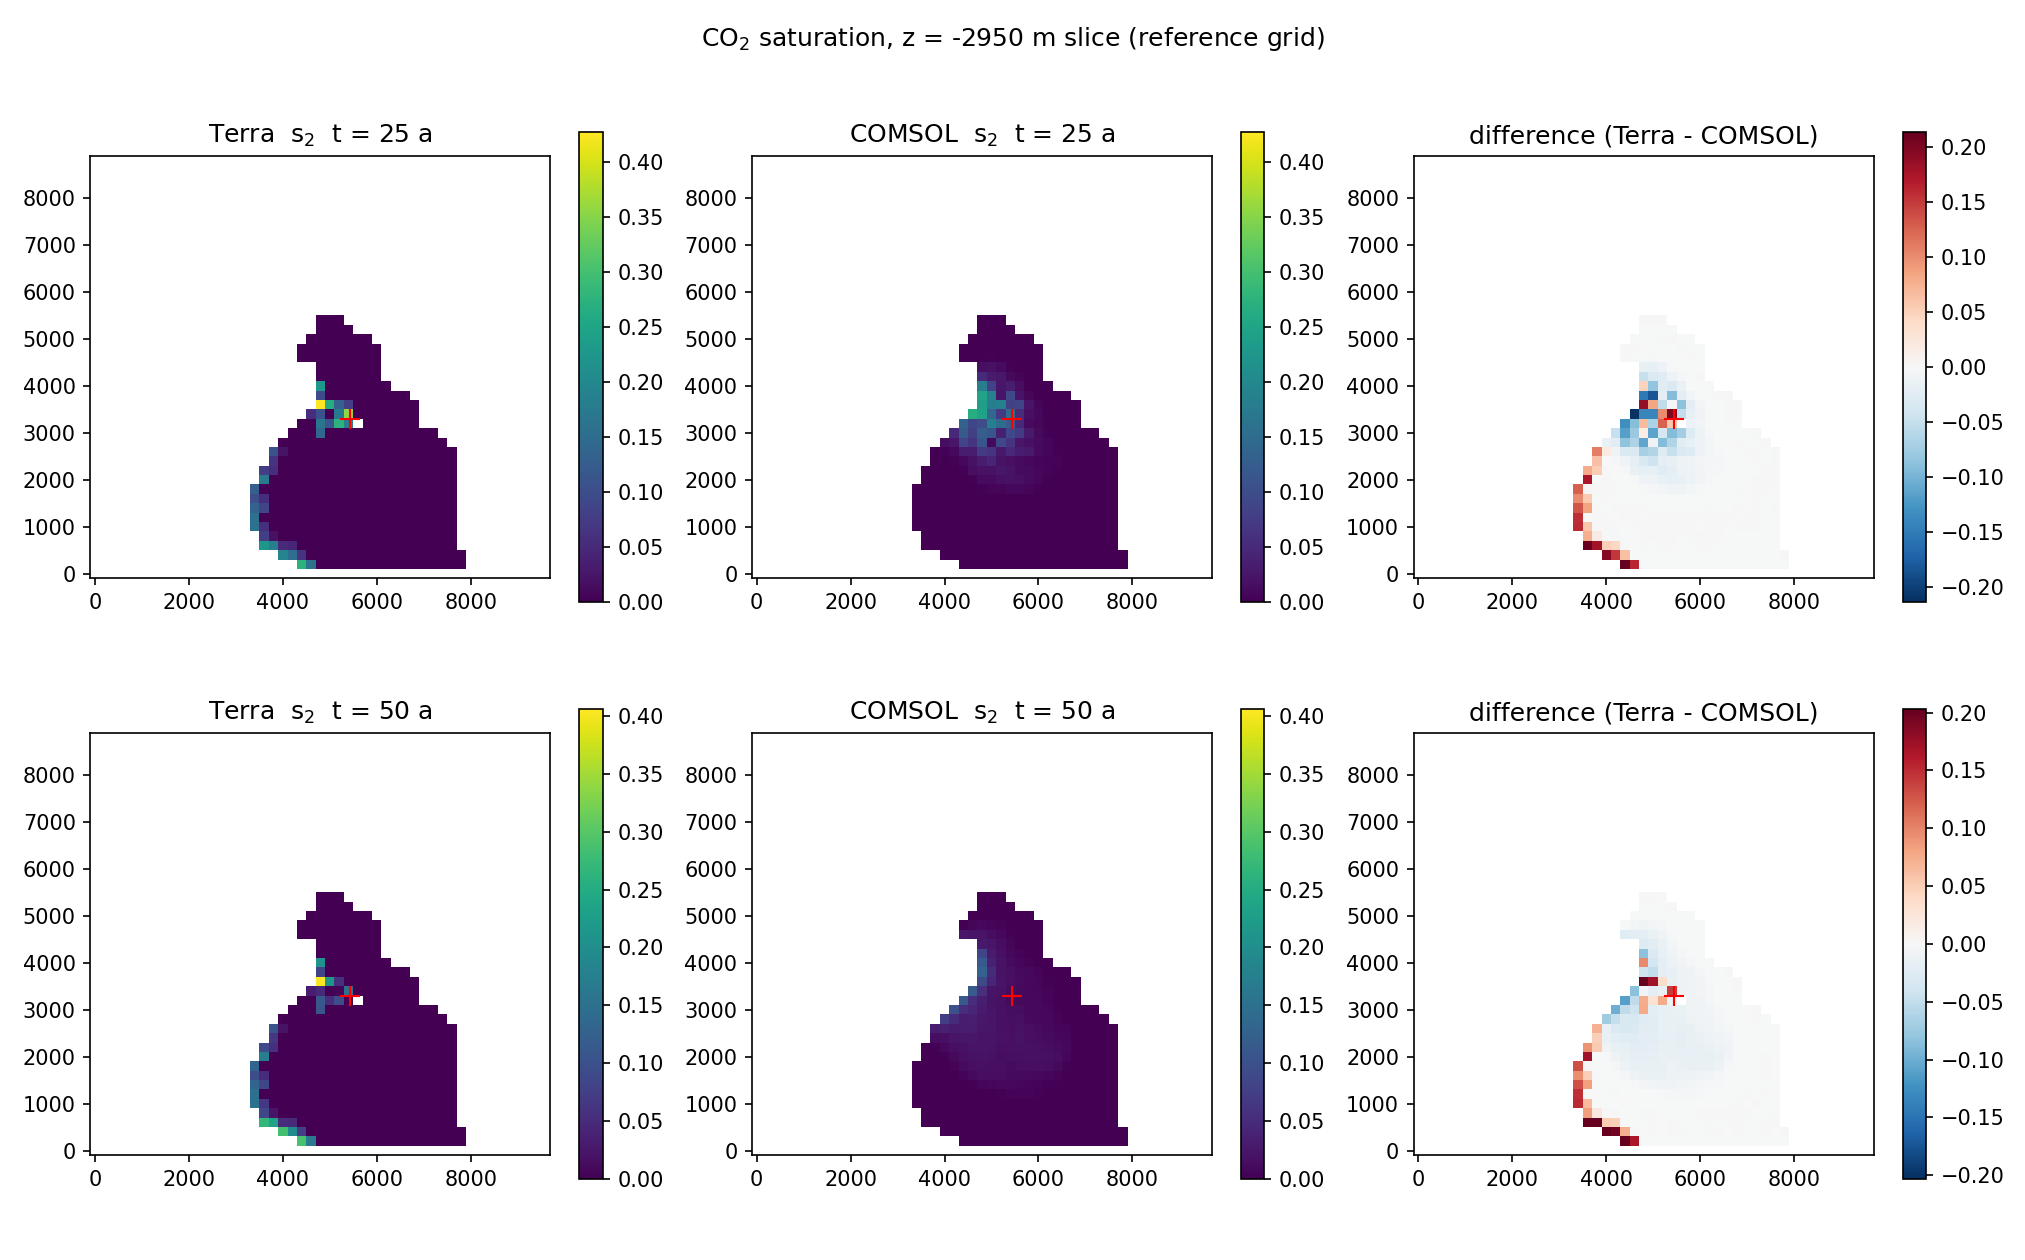
New Terra/COMSOL comparisonTerra, COMSOL and difference maps of carbon dioxide saturation at 25 and 50 years on the same reference grid
CO2 saturation at 25 and 50 years. The RMS difference is 0.035 at the end of injection and 0.062 after 25 years of shut-in. Local front cells reach larger differences - 0.55 at 25 years and 0.74 at 50 years - which rules out a claim of pointwise identity.
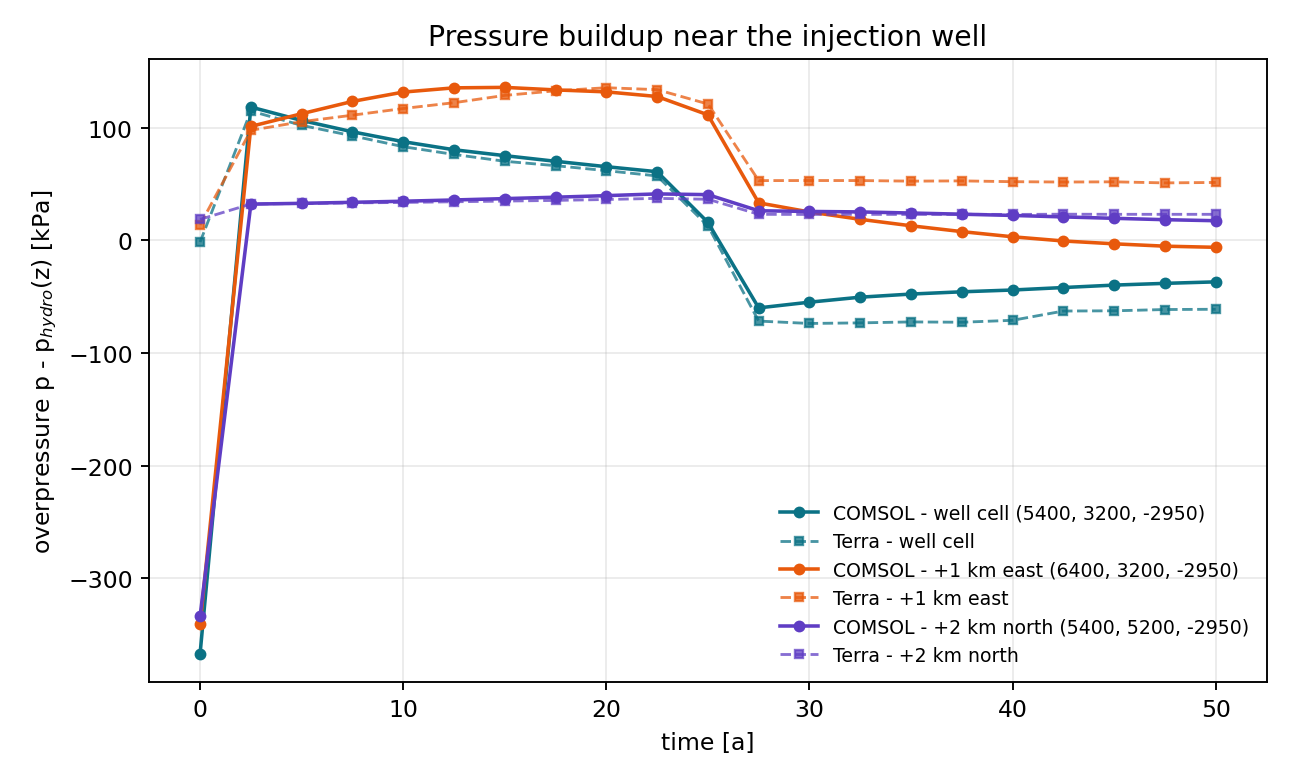
New Terra/COMSOL comparisonTerra and COMSOL pressure buildup histories near the injection well and at two offset probes
Pressure buildup near the well. Liquid-pressure RMS differences are 1.57 kPa at 2.5 years, 7.23 kPa at 25 years and 10.18 kPa at 50 years.
New Terra mass auditTerra injected and in-place carbon dioxide mass over fifty years with mass closure ratio
Gas-mass ledger. The prescribed source injects 1.18104×10¹⁰ kg. Terra's in-place-to-injected ratio is 0.9998 at the end of injection, and the maximum post-shut-in drift is 0.08%.
Physical interpretation

Buoyancy controls the late plume; mobility controls the front

Injection sets the plume volume. Reservoir structure and phase mobility decide where that volume goes.

During the first 25 years, pressure rises around the well and CO2 spreads through the higher-permeability parts of the formation. Its lower density also drives it upward toward the reservoir top.

After shut-in, the total free-gas mass stays nearly constant while gravity and capillary pressure redistribute the plume. In the COMSOL source figures, the top-view footprint moves up-dip toward the right and upper boundaries. Terra reproduces the global plume volume and pressure response closely, while the sharper saturation front remains more sensitive to discretisation and mobility differences.

Pressure response

The pressure field stays close across the 50-year comparison, with a 10.18 kPa RMS difference at the final frame.

Global storage

The corrected run closes the injection ledger and holds the in-place mass after shut-in.

Plume migration

Terra follows the COMSOL plume volume to within 0.71% at 50 years.

Remaining difference

Local saturation-front errors are larger than the global metrics. They are shown directly rather than hidden by a single summary score.

Sources and provenance

Files and references used for this page

  1. COMSOL Multiphysics 6.3, CO2 Storage in a Geologic Formation, Application ID 102791. Supplied Liquid & Gas Properties and Subsurface Flow PDF editions.
  2. Reviewed source package: carbon_dioxide_storage.mph (solved model), carbon_dioxide_storage.java (model-tree export), carbon_dioxide_storage.mphbin (imported geometry), carbon_dioxide_storage_porper.csv (Johansen porosity and permeability cloud), and carbon_dioxide_storage_parameters.txt.
  3. Class, H. et al. (2009), “A benchmark study on problems related to CO2 storage in geologic formations,” Computational Geosciences, 13(4), 409–434.
  4. Johansen formation data courtesy of the Norwegian Petroleum Directorate, the University of Bergen and SINTEF. The dataset is distributed under the Open Database License; individual contents use the Database Contents License.
  5. Terra validation package: solved COMSOL mesh and reference exports, corrected 50-year Terra result, comparison grid, field metrics and mass audit.

Continue through the CO2 model series

See three additional Terra injection problems at sample, aquifer and coupled aquifer-caprock scales.

View the three-model series