Problem 1Solved
A pressure-controlled well drives CO2 through a compact aquifer beneath a low-permeability caprock.
- Model state
- Solved
- Horizon
- 5 h
- Mesh
- 240 nodes / 208 quads
Three CO2 injection problems were modeled in Terra. They cover pressure-controlled injection into a 10 m sample, long-term radial injection into a 10 km aquifer, and a fully coupled aquifer-caprock system.
Each problem is presented as a separate Terra model with its geometry, physics, loading schedule, mesh, solved fields, and physical interpretation.
A pressure-controlled well drives CO2 through a compact aquifer beneath a low-permeability caprock.
A full-height well injects CO2 into a 10 km aquifer, resolving density, pressure, and saturation over 370 days.
Two-phase flow, stress, strain, porosity, and displacement evolve together beneath a deformable caprock.
A compact Cartesian model isolates the two-phase transport response. The well pressure rises over one hour, then remains fixed while the gas-rich region grows across the aquifer.
The lower 10 x 10 m domain is aquifer rock and the upper 10 x 10 m domain is caprock. The two-dimensional Cartesian model solves water and gas component balances with dissolved CO2 at 320 K. Mechanical equilibrium and heat transport are disabled.
| Condition | Location / interval | Value |
|---|---|---|
| Bottom liquid pressure | Line 1, y = 0 m | 10.1 MPa |
| Top liquid pressure | Line 4, y = 20 m | 9.9 MPa |
| Initial liquid pressure | All domains | Pl = 10.1 - 0.01y MPa |
| Initial gas pressure | All domains | 0.1 MPa |
| Equilibration | 0-1 h | No injection |
| Pressure ramp | Well line, 1-2 h | Gas pressure increases to 11 MPa |
| Constant injection pressure | Well line, 2-5 h | 11 MPa |
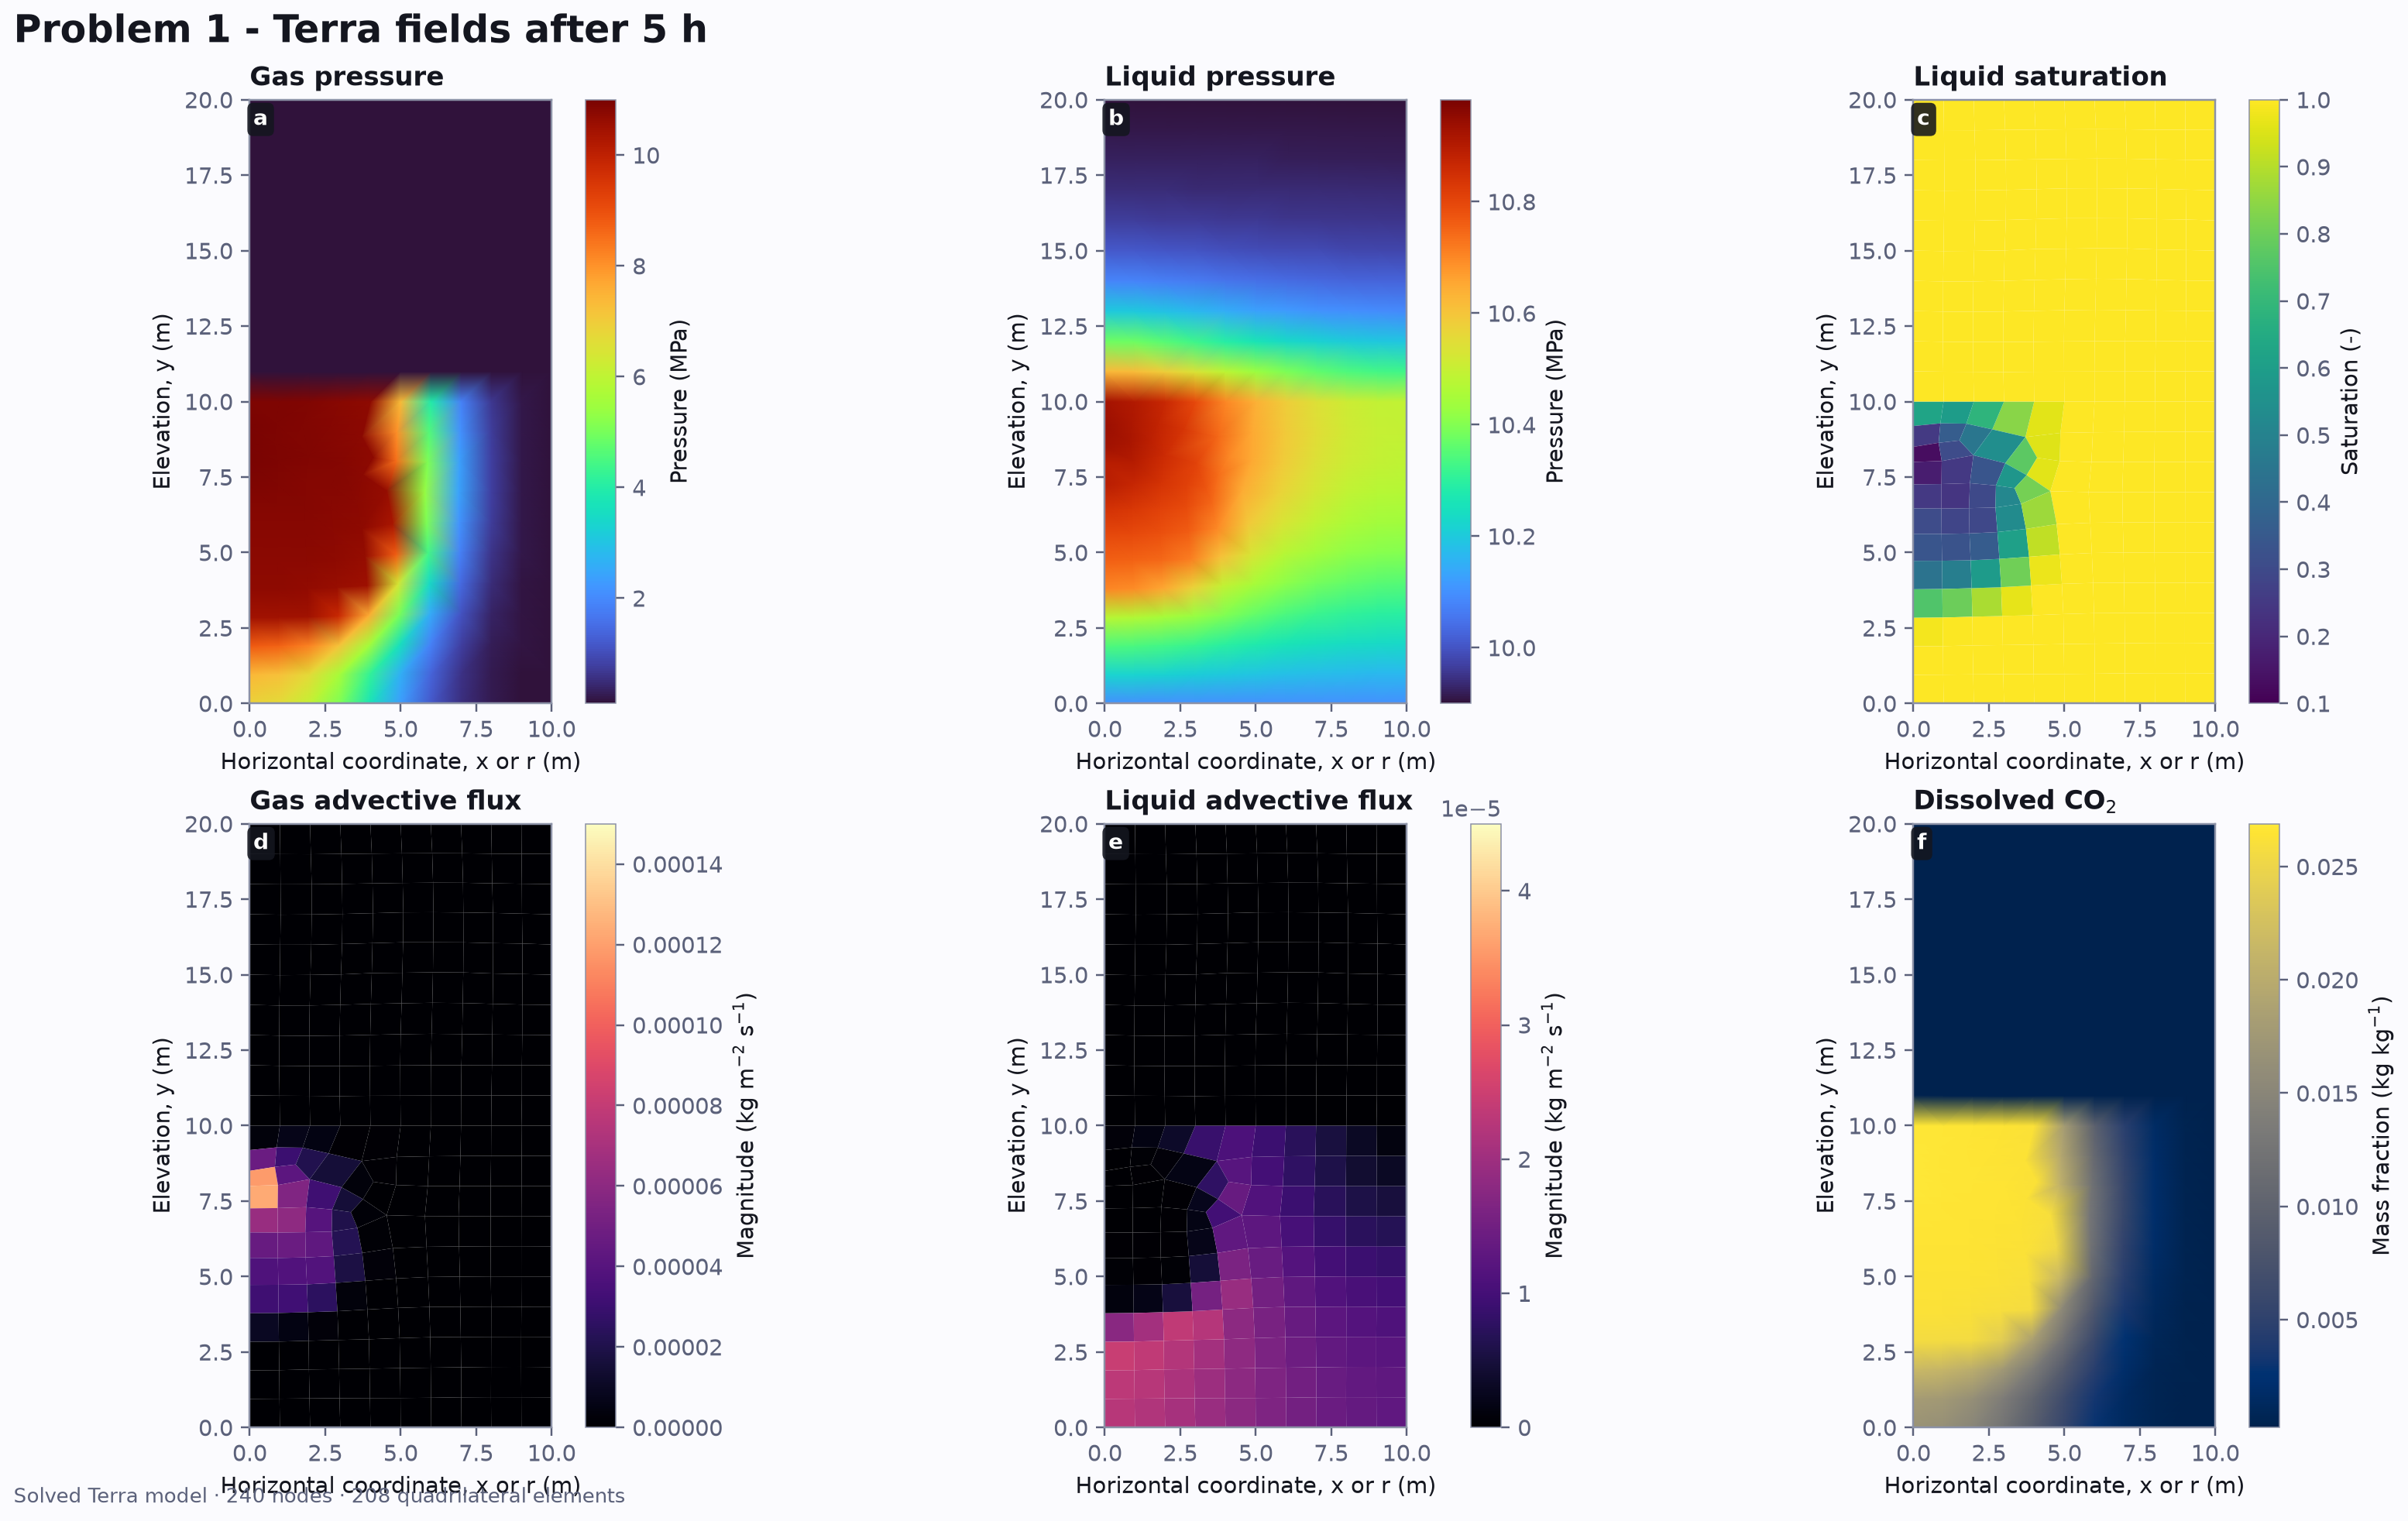
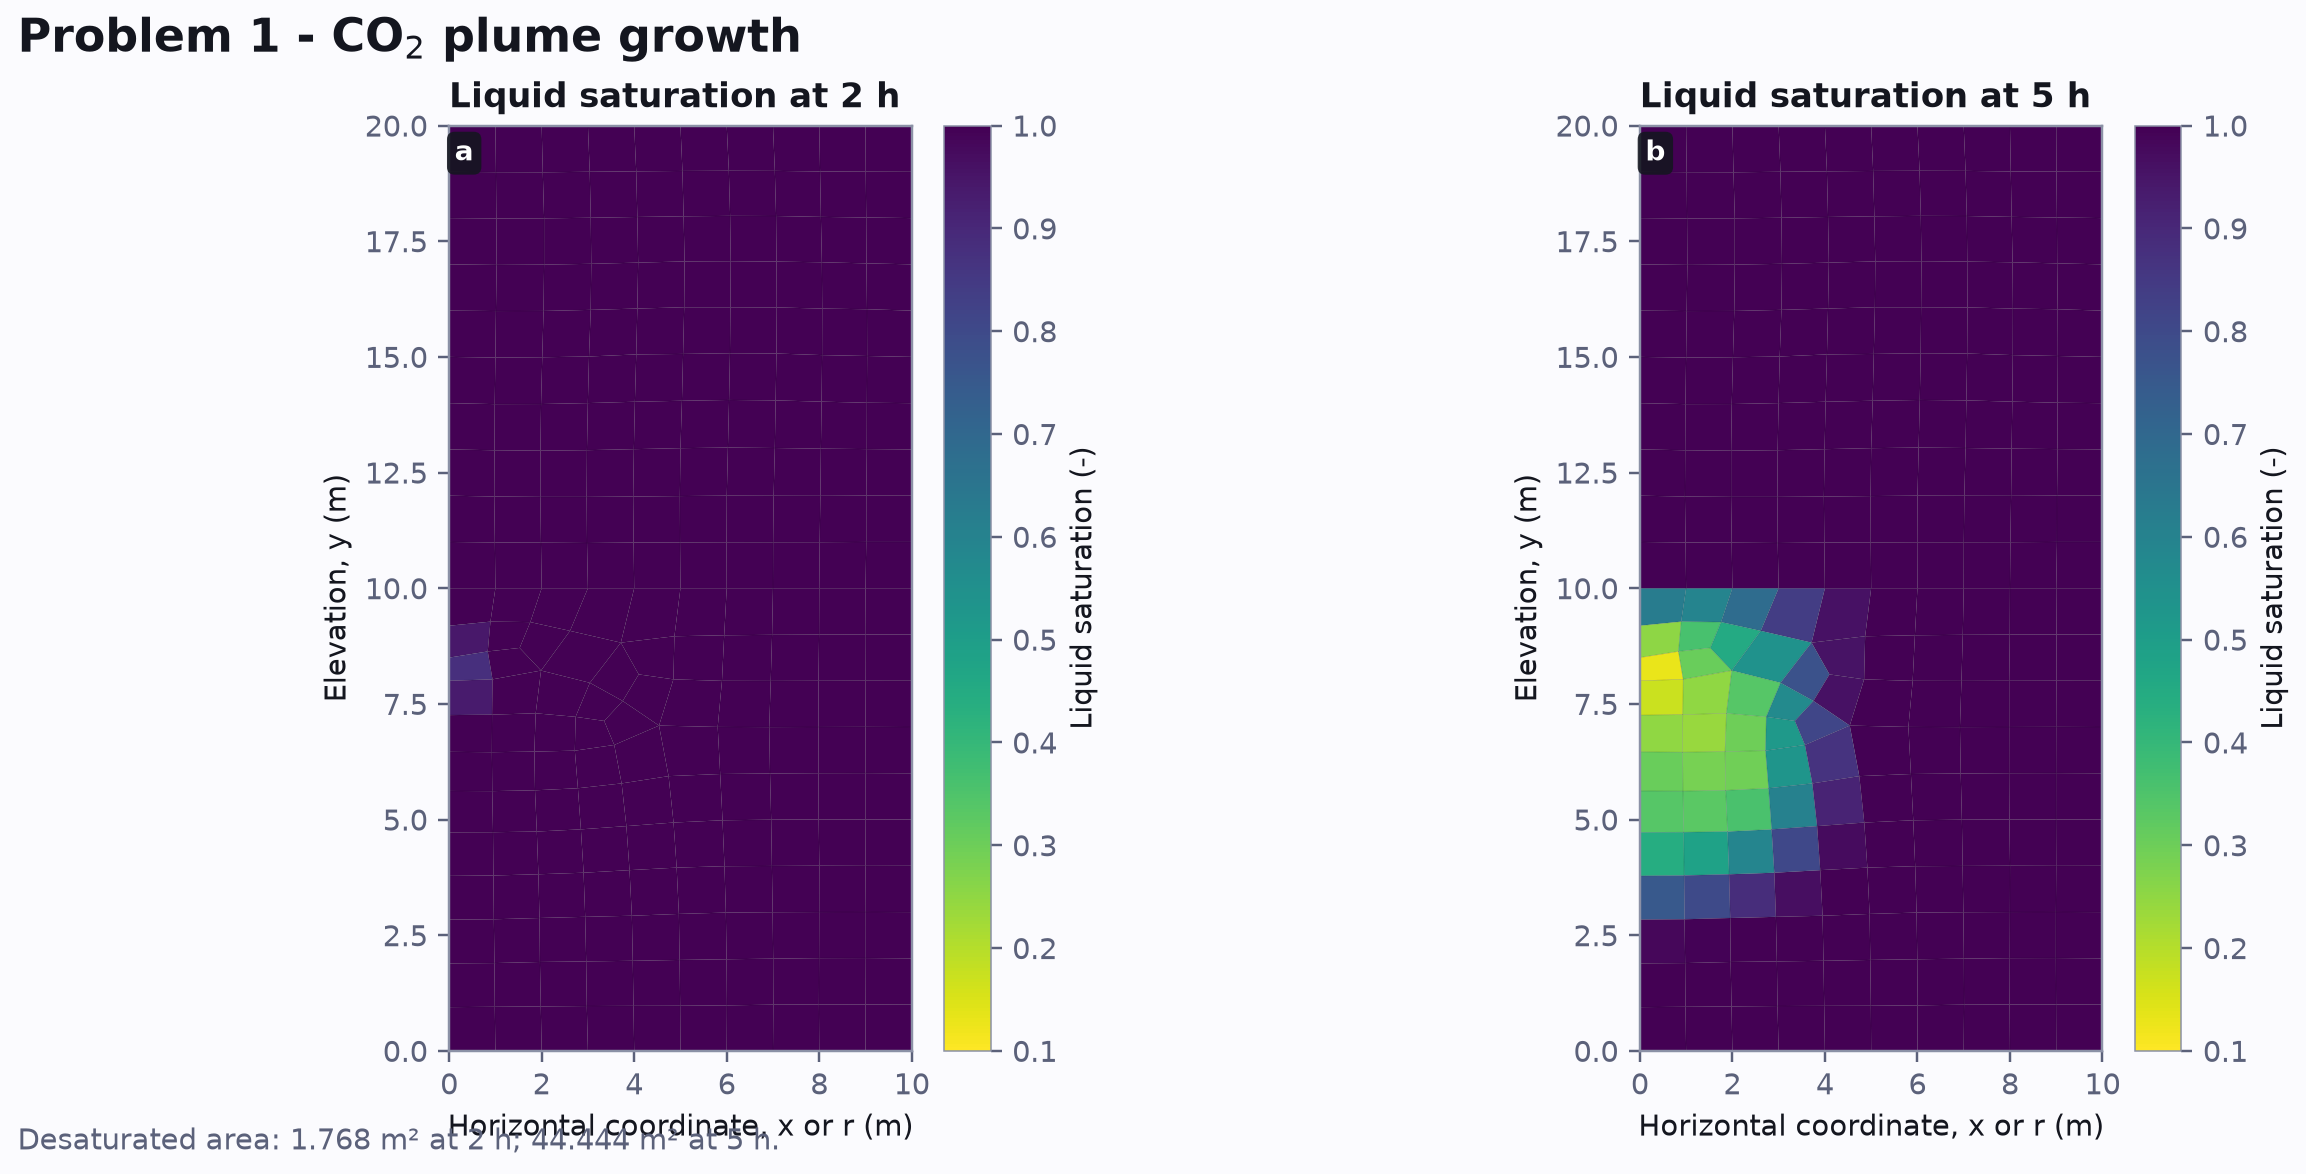
Gas entry creates a moving saturation front, while dissolved CO2 changes the brine density behind it.
Gas pressure first rises around the short well section. Where gas pressure overtakes liquid pressure, the aquifer desaturates. Liquid flow weakens inside the gas-rich region and becomes concentrated around the advancing front.
At 5 h, Terra gives 0.1-10.9998 MPa gas pressure, 9.9-10.9377 MPa liquid pressure, 0.12849-1.0 liquid saturation, and 0.000244444-0.0268885 kg/kg dissolved CO2. The brine density range is 1087.44-1091.93 kg/m3.
This model extends the flow formulation to a 10 km axisymmetric aquifer and follows one year of injection after equilibration. Radial grading resolves the well while retaining the far boundary.
The homogeneous aquifer runs from r = 0.15 m to 10,000 m and from y = -100 m to 0 m. A 100 m gravel strip extends the outer radius to 10,100 m. The model is axisymmetric around y and solves isothermal water and gas balances with dissolved CO2 at 320 K. Mechanics is disabled.
| Condition | Location / interval | Value |
|---|---|---|
| Outer liquid pressure | Buffer line 2 | 10.0 MPa |
| Initial liquid pressure | All domains | Pl = 10 - 0.01y MPa |
| Initial gas pressure | All domains | 0.1 MPa |
| Equilibration | 0-5 d | No injection |
| Flow ramp | Well wall, 5-6 d | 0 to 0.84 kg m-2 s-1 |
| Constant wall flux | 6-370 d | 0.84 kg m-2 s-1 |
| Axisymmetric conversion | 2 pi r h = 94.2478 m2 | 79.1681 kg/s |
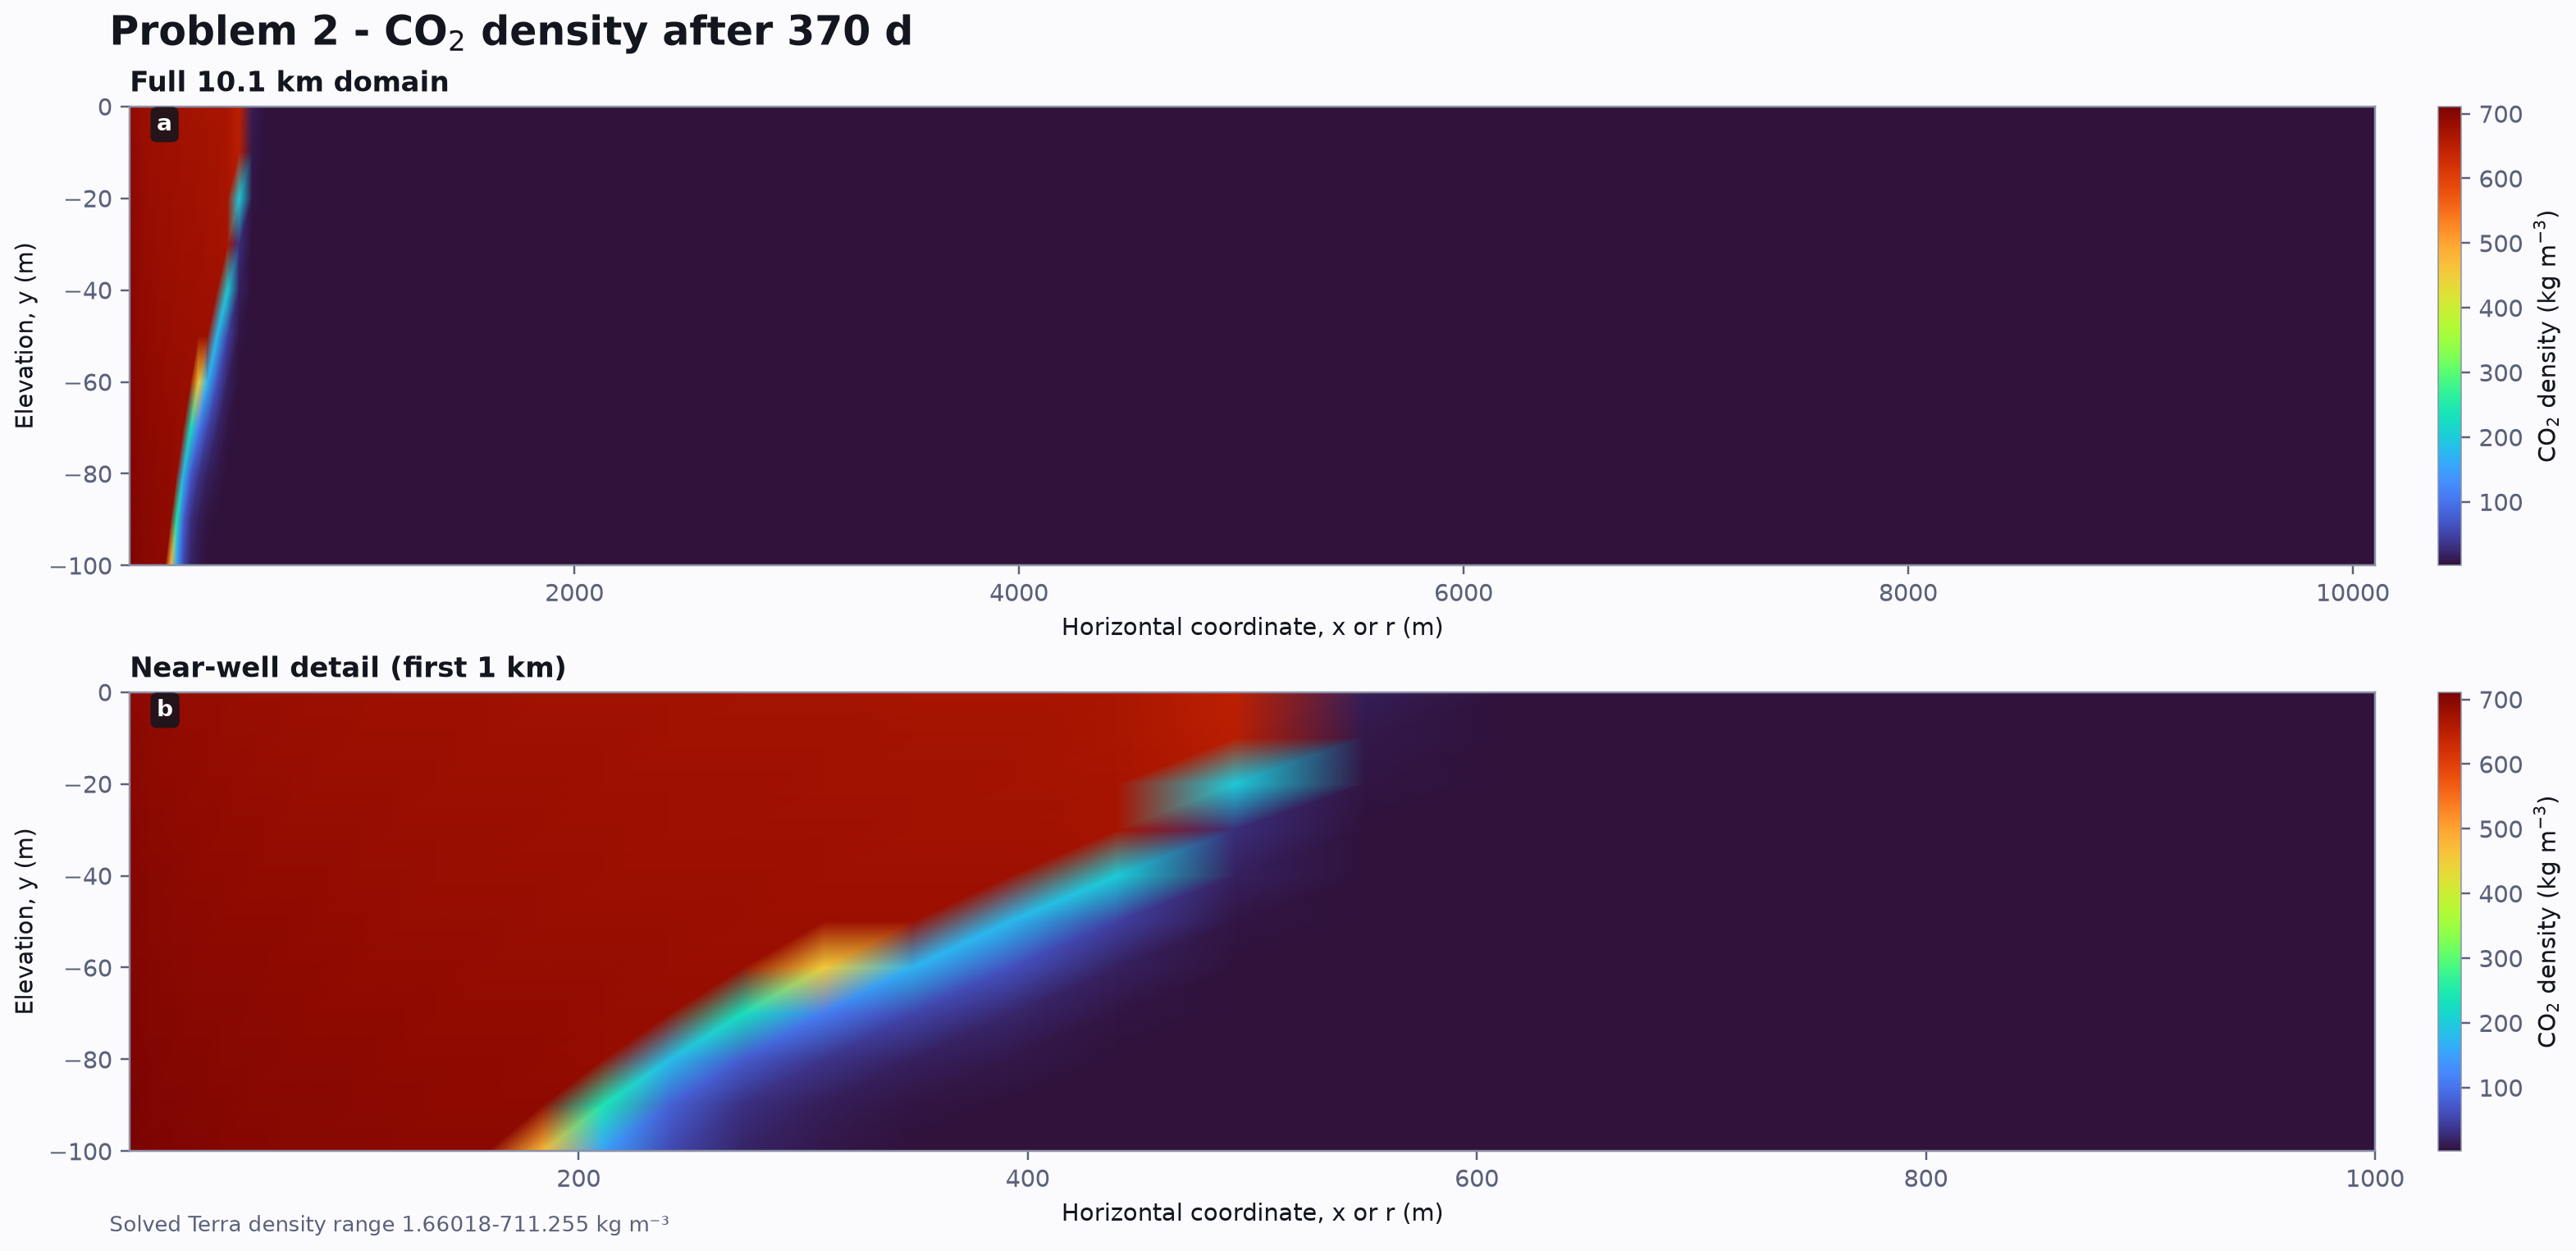
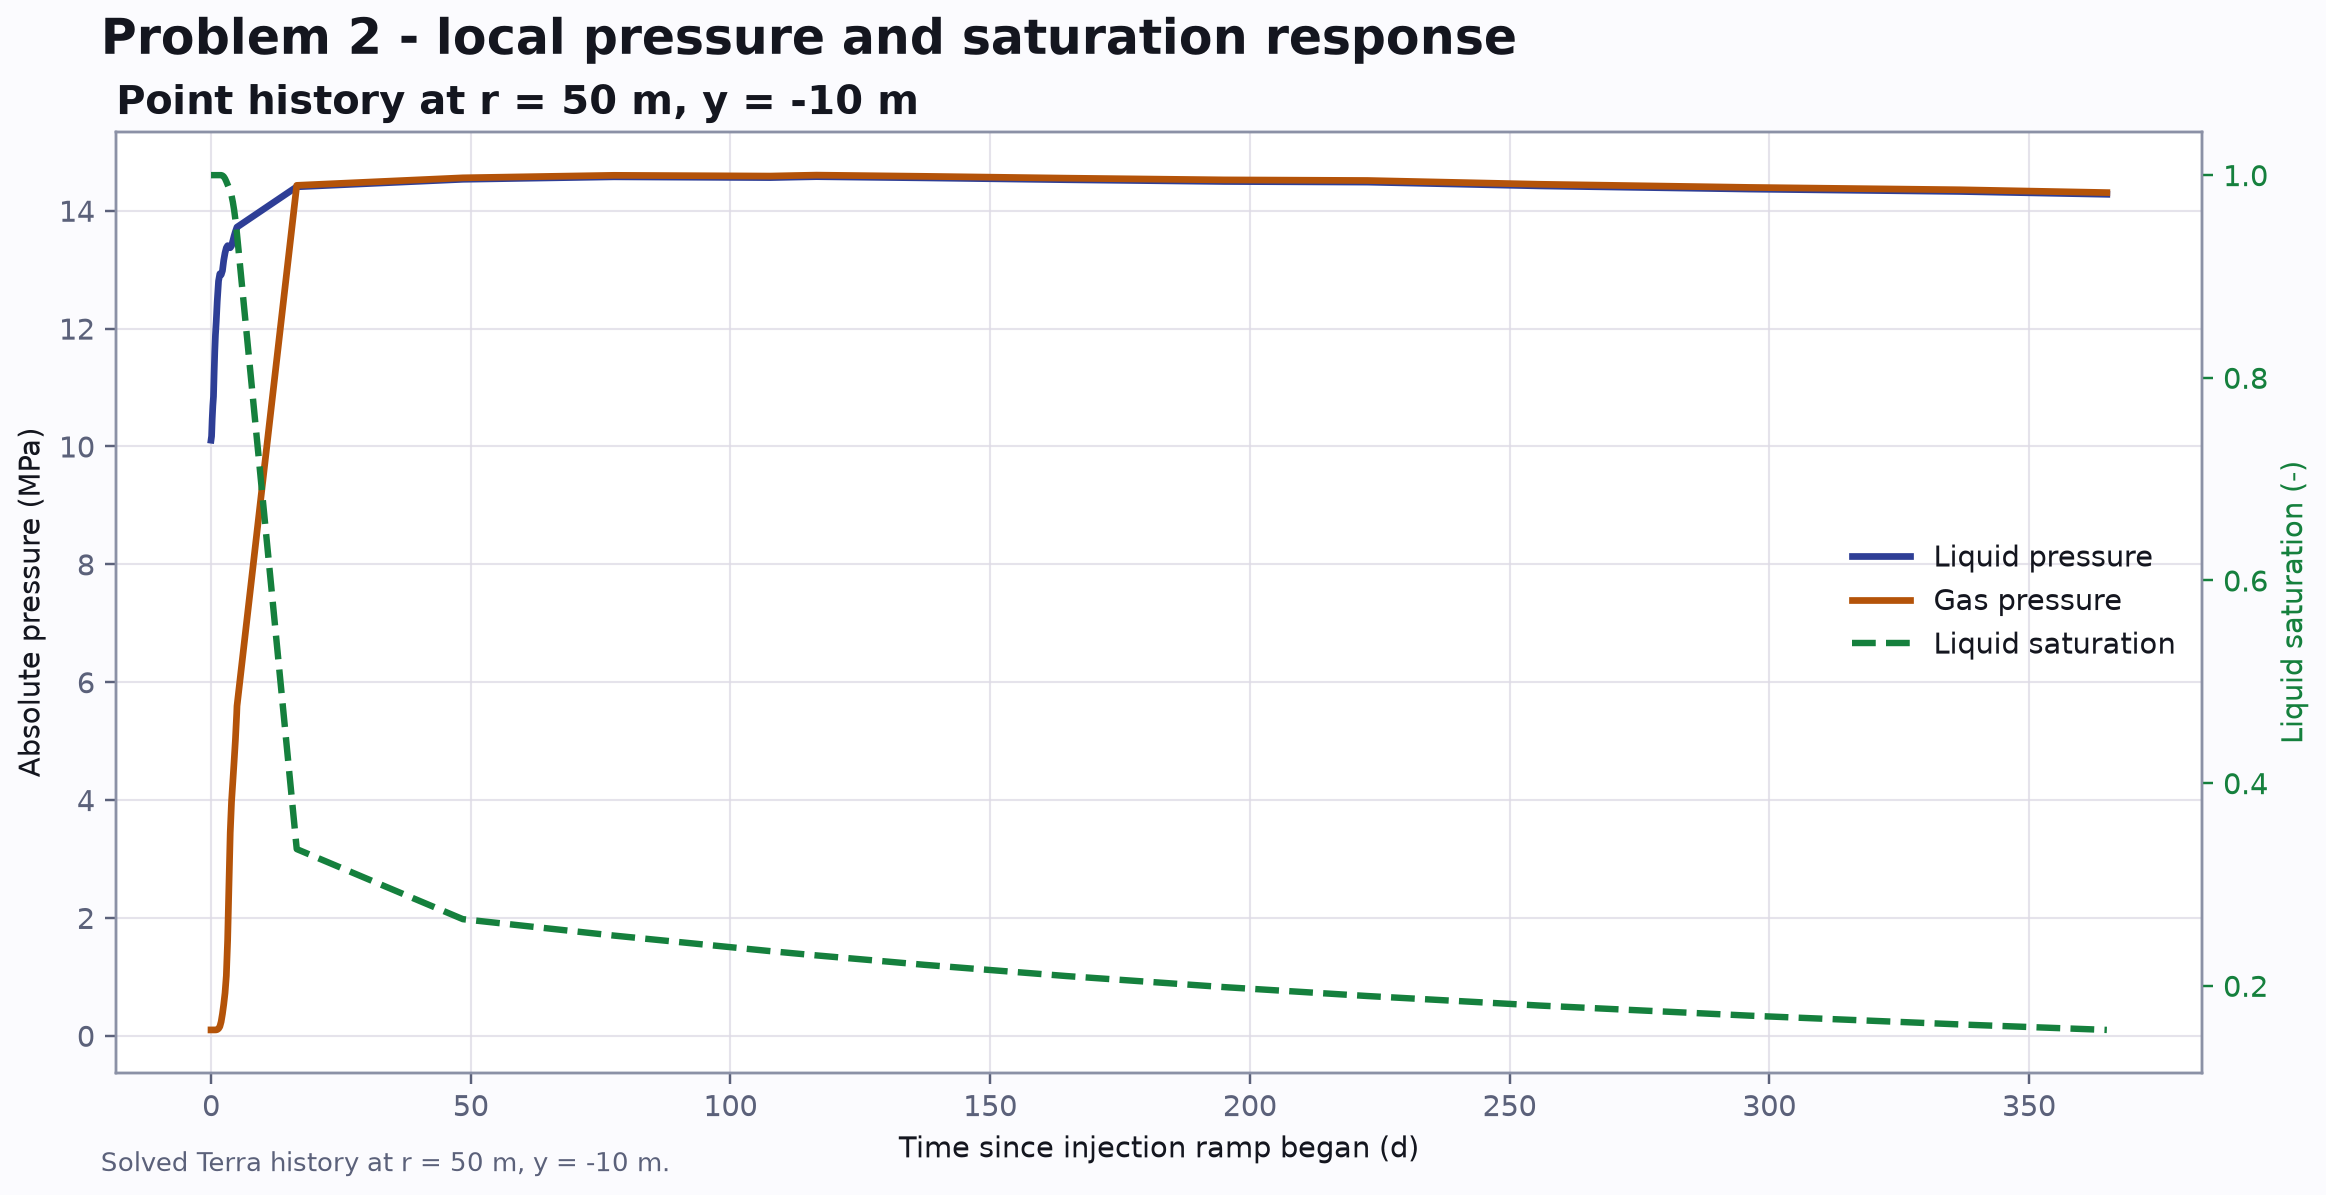
Pressure controls gas density and mobility, so the plume evolves under a constant imposed mass flux.
CO2 density is highest near the pressurised well and falls sharply across the plume boundary. Liquid saturation drops after gas pressure exceeds liquid pressure. The long radial domain keeps the far boundary separate from the near-well response.
The later pressure decline follows from the gas phase having much lower viscosity than brine. As gas occupies more pore space, mobility increases and the imposed wall flux requires less pressure support.
The third model activates stress equilibrium and deformation-dependent porosity. Injection changes pressure, saturation, effective stress, strain, porosity, and displacement in one axisymmetric calculation.
The aquifer occupies r = 0.15-2,000 m and y = -100-0 m. A gravel strip extends to r = 2,100 m. The caprock occupies r = 0.15-2,100 m and y = 0-100 m. The axisymmetric model is isothermal at 59.5 degrees C and solves radial and vertical displacement together with liquid and gas pressure.
| Condition | Location / interval | Value |
|---|---|---|
| Vertical rollers | Bottom lines 4 and 5 | uy = 0; penalty 1015 |
| Radial rollers | Outer lines 3 and 9 | ur = 0; penalty 1015 |
| Top load | Caprock top | sigmay = -28 MPa |
| Outer liquid pressure | Gravel top, r = 2000-2100 m | 15 MPa |
| Initial liquid pressure | All domains | 14 MPa at y = 100 m to 16 MPa at y = -100 m |
| Initial normal stress | All domains | (-19.6, -28, -19.6) to (-22.4, -32, -22.4) MPa |
| Equilibration | -5 to 0 d | Coupled equilibrium |
| Ramp / constant wall flux | 0-0.1 d / 0.1-7 d | 0 to 0.175 / 0.175 kg m-2 s-1 |
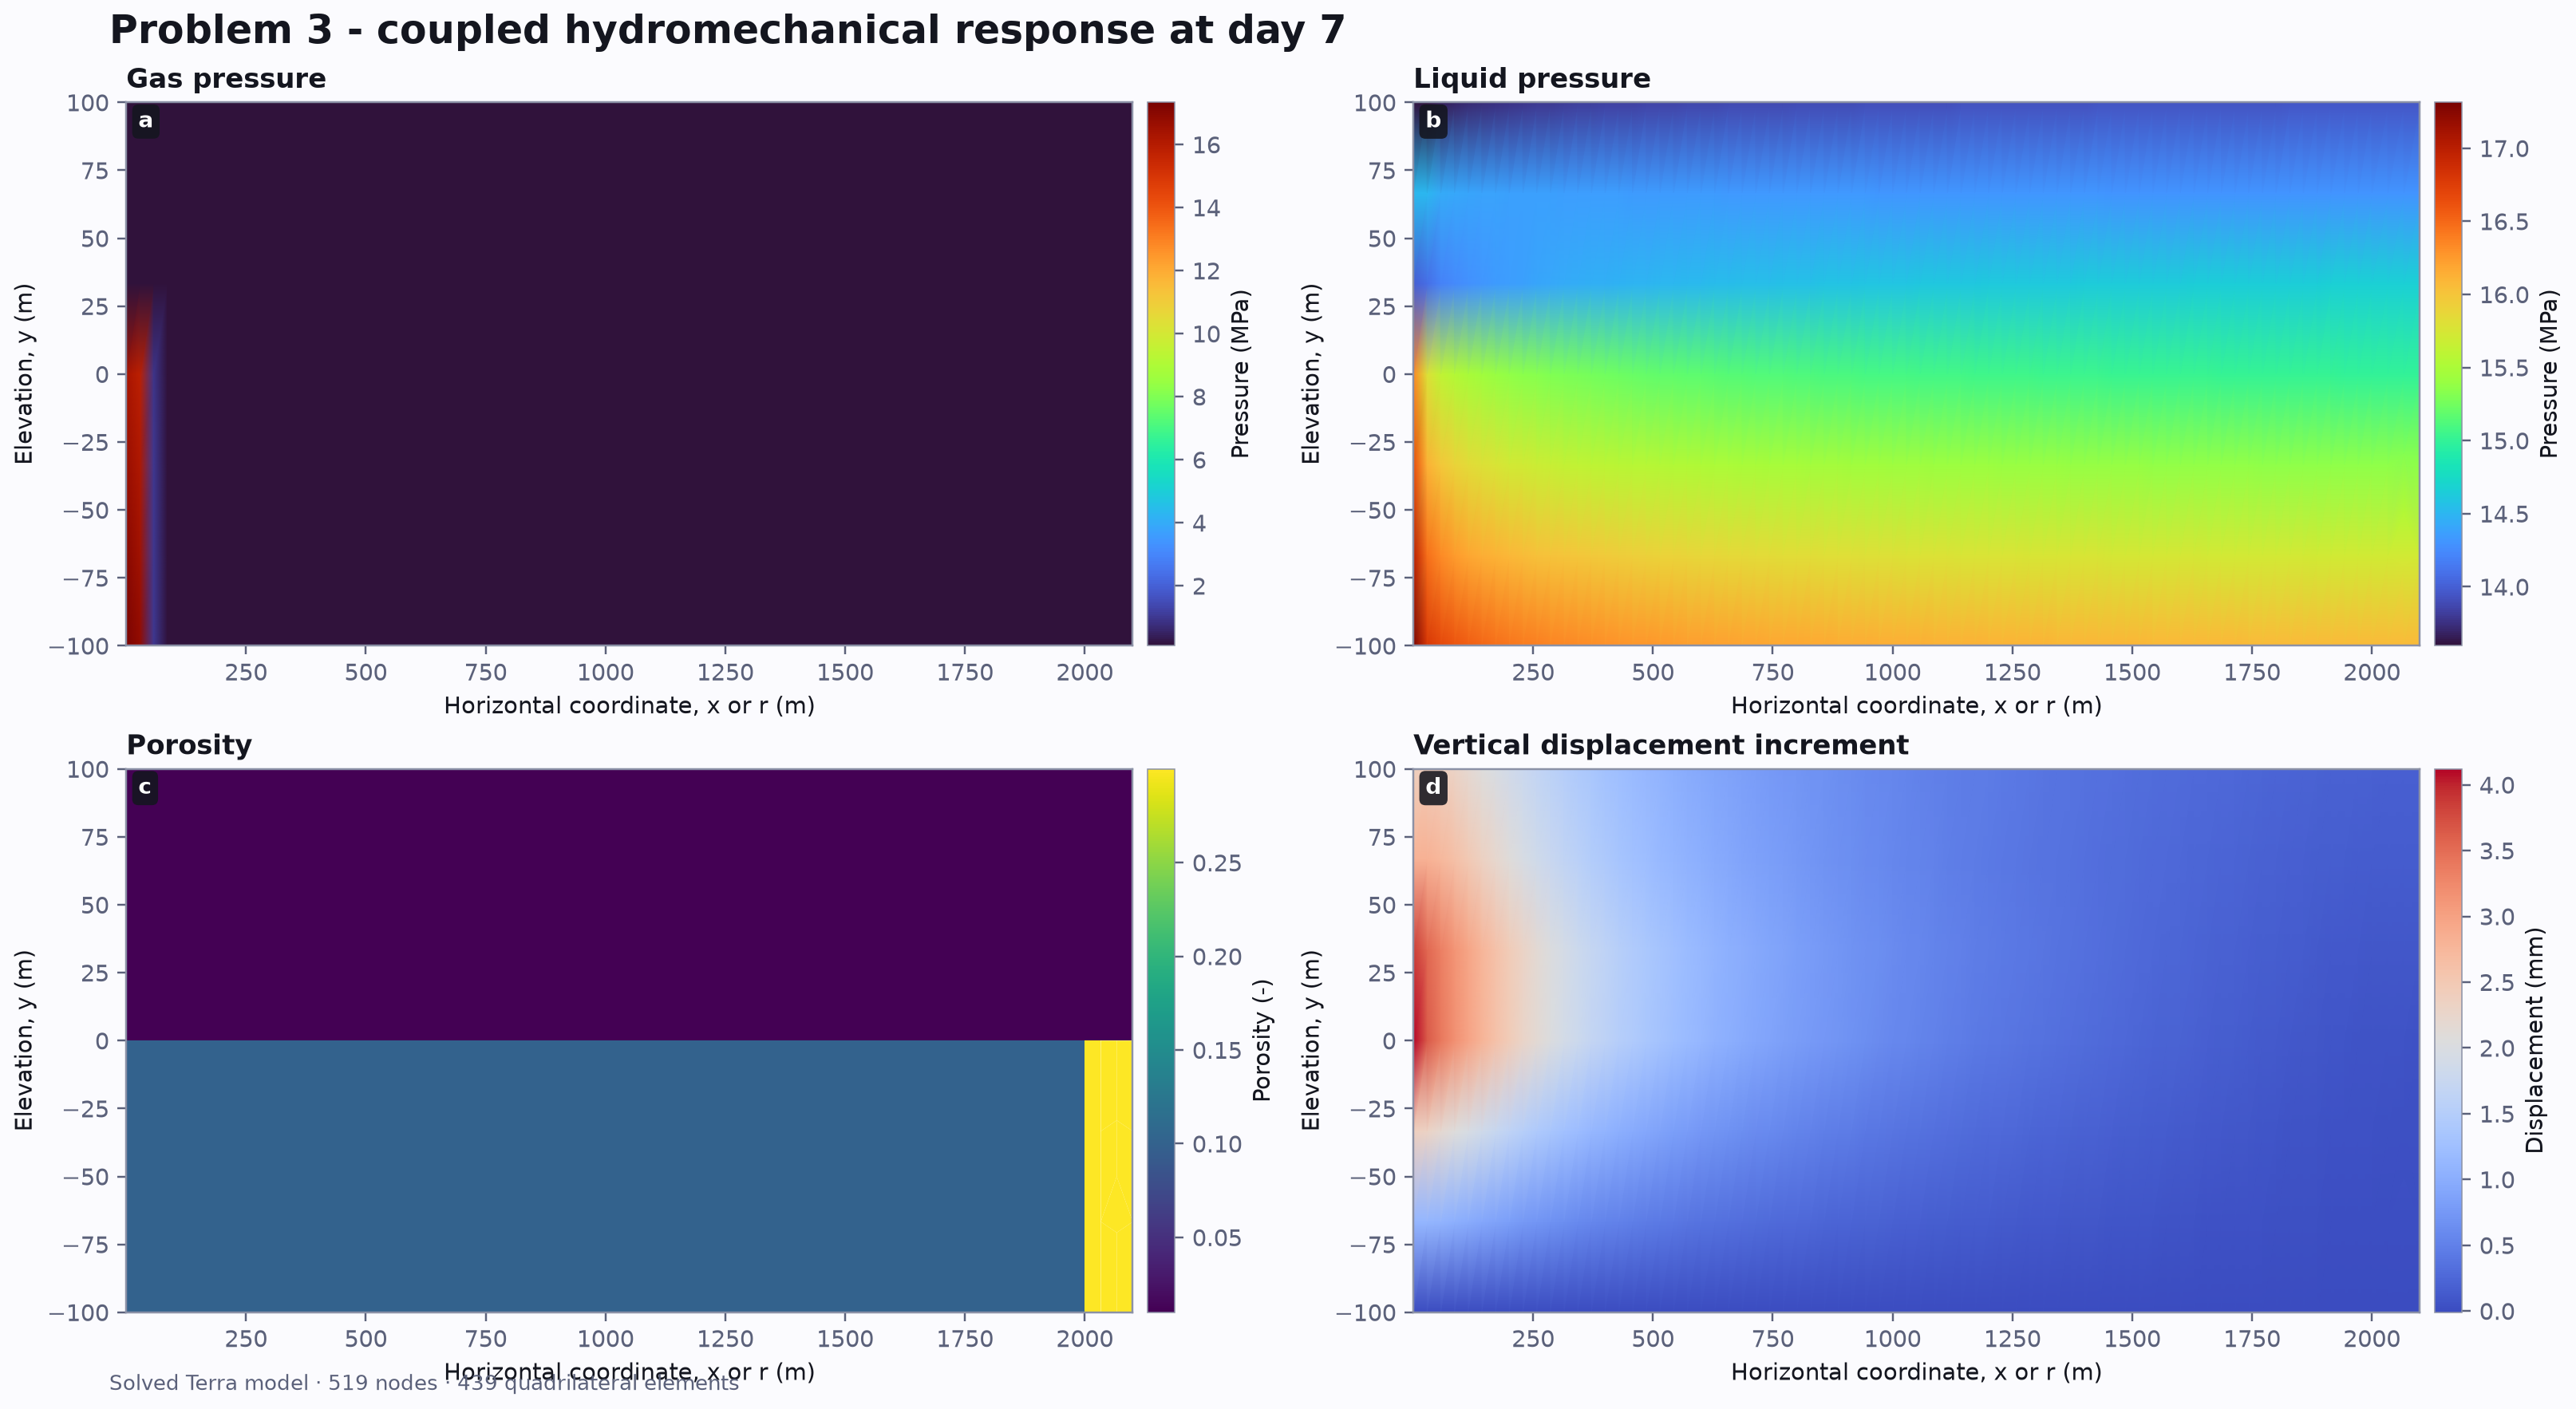
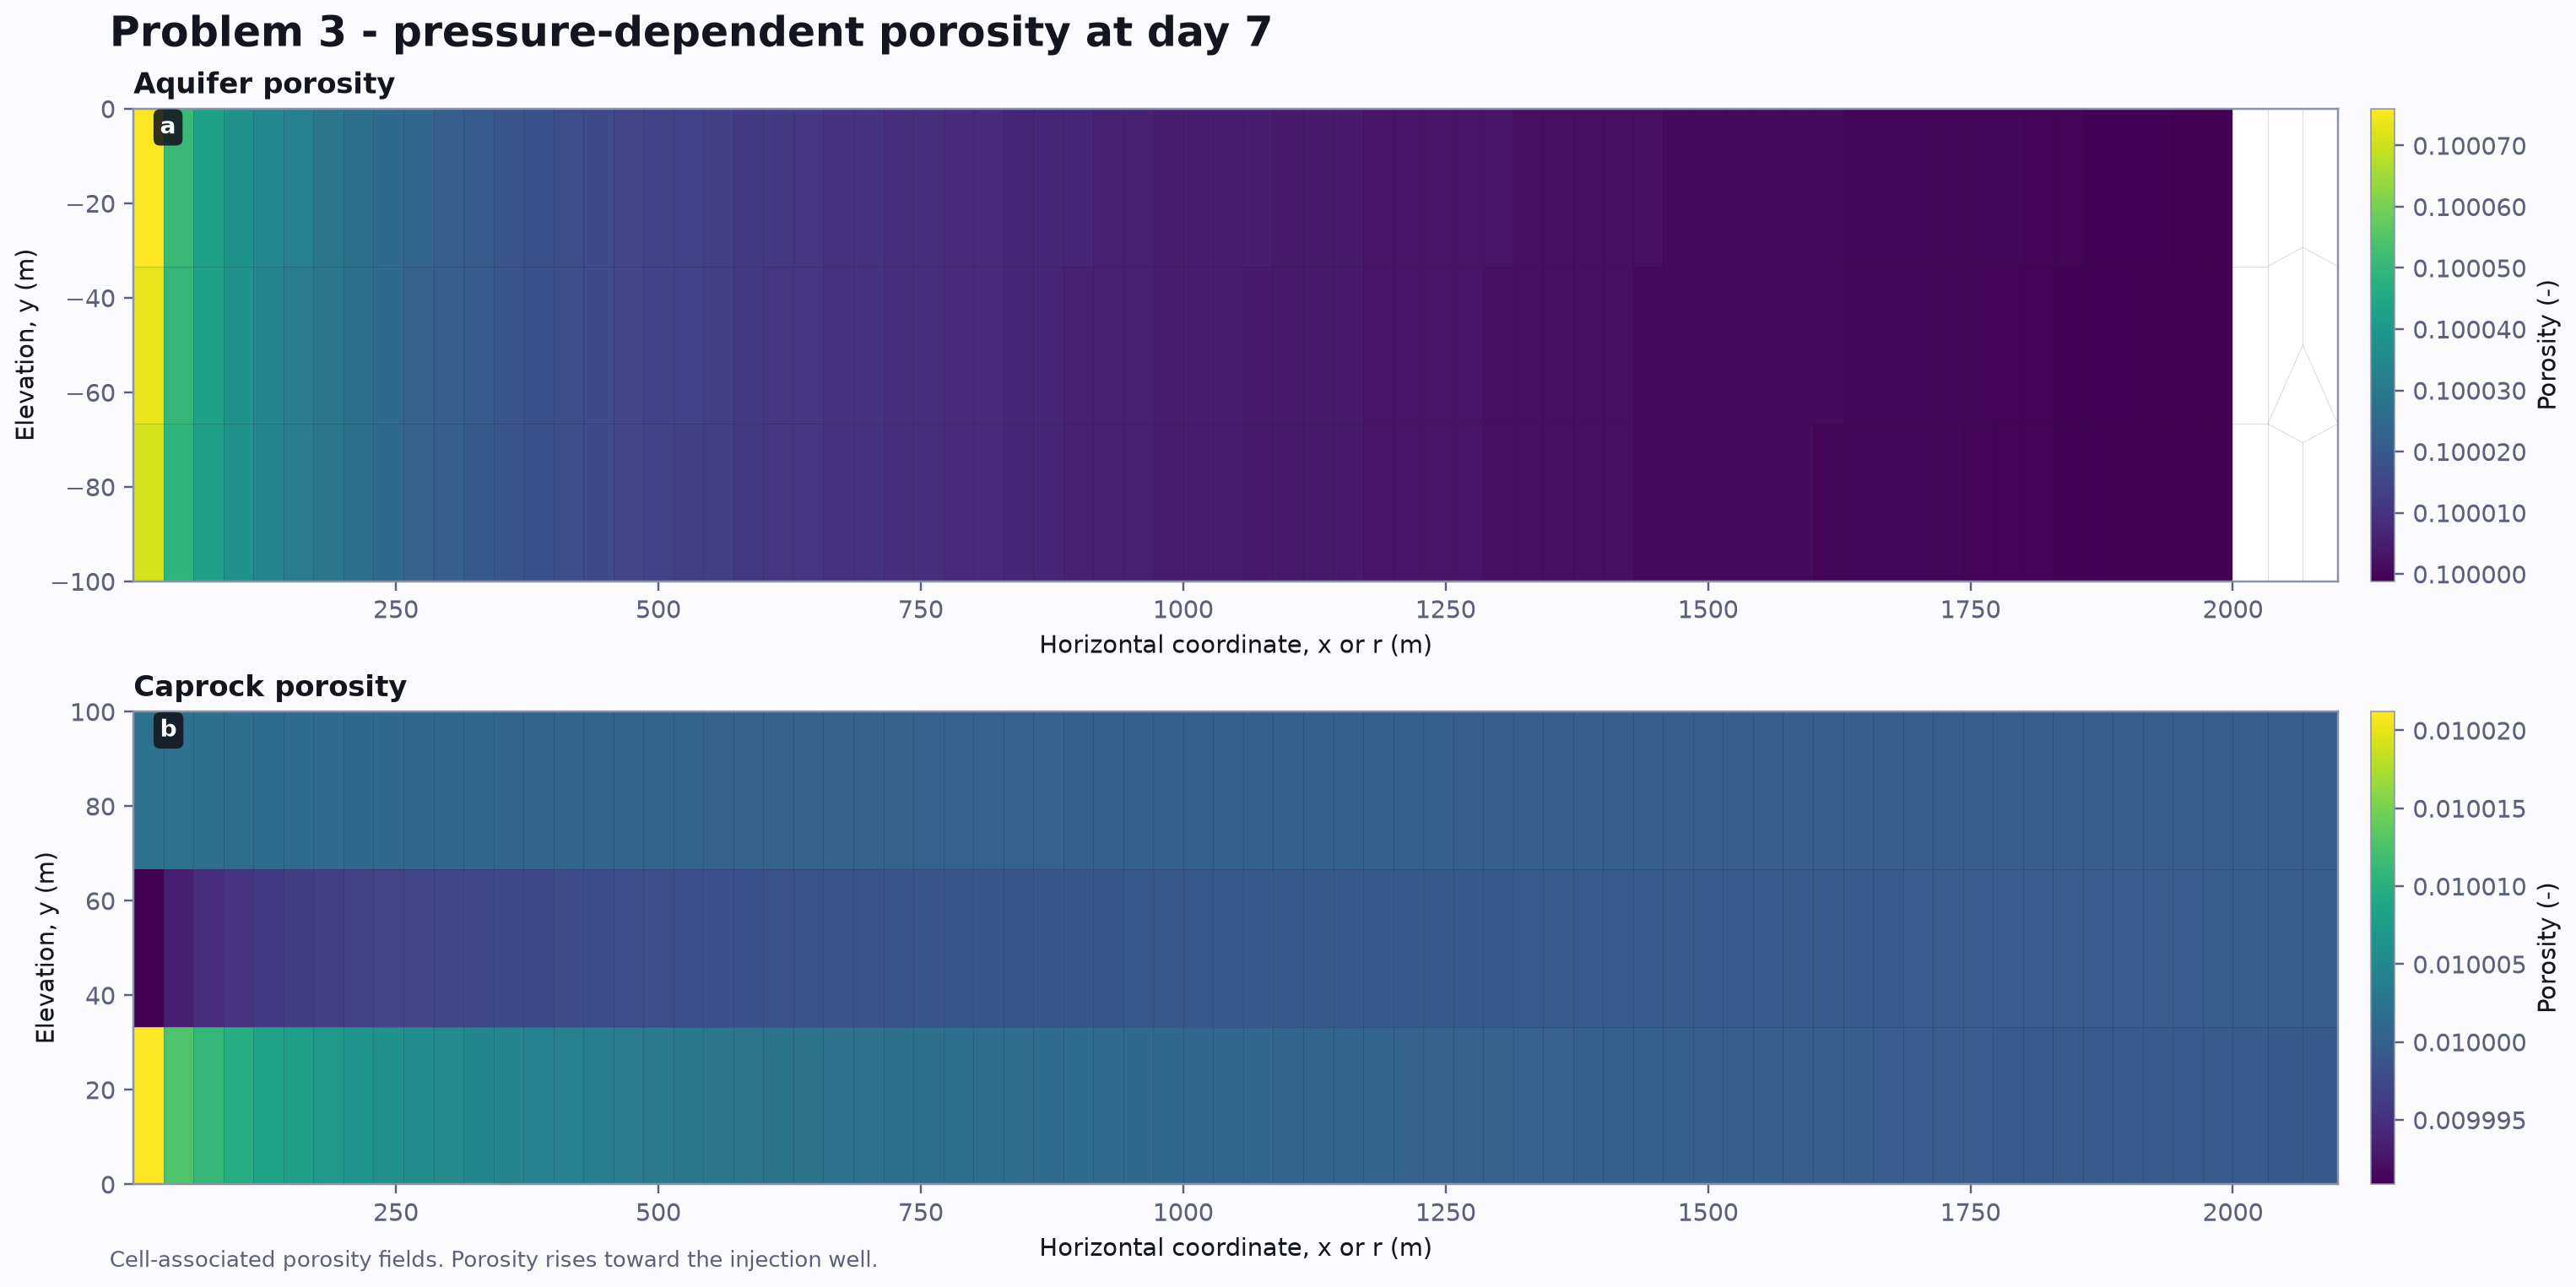
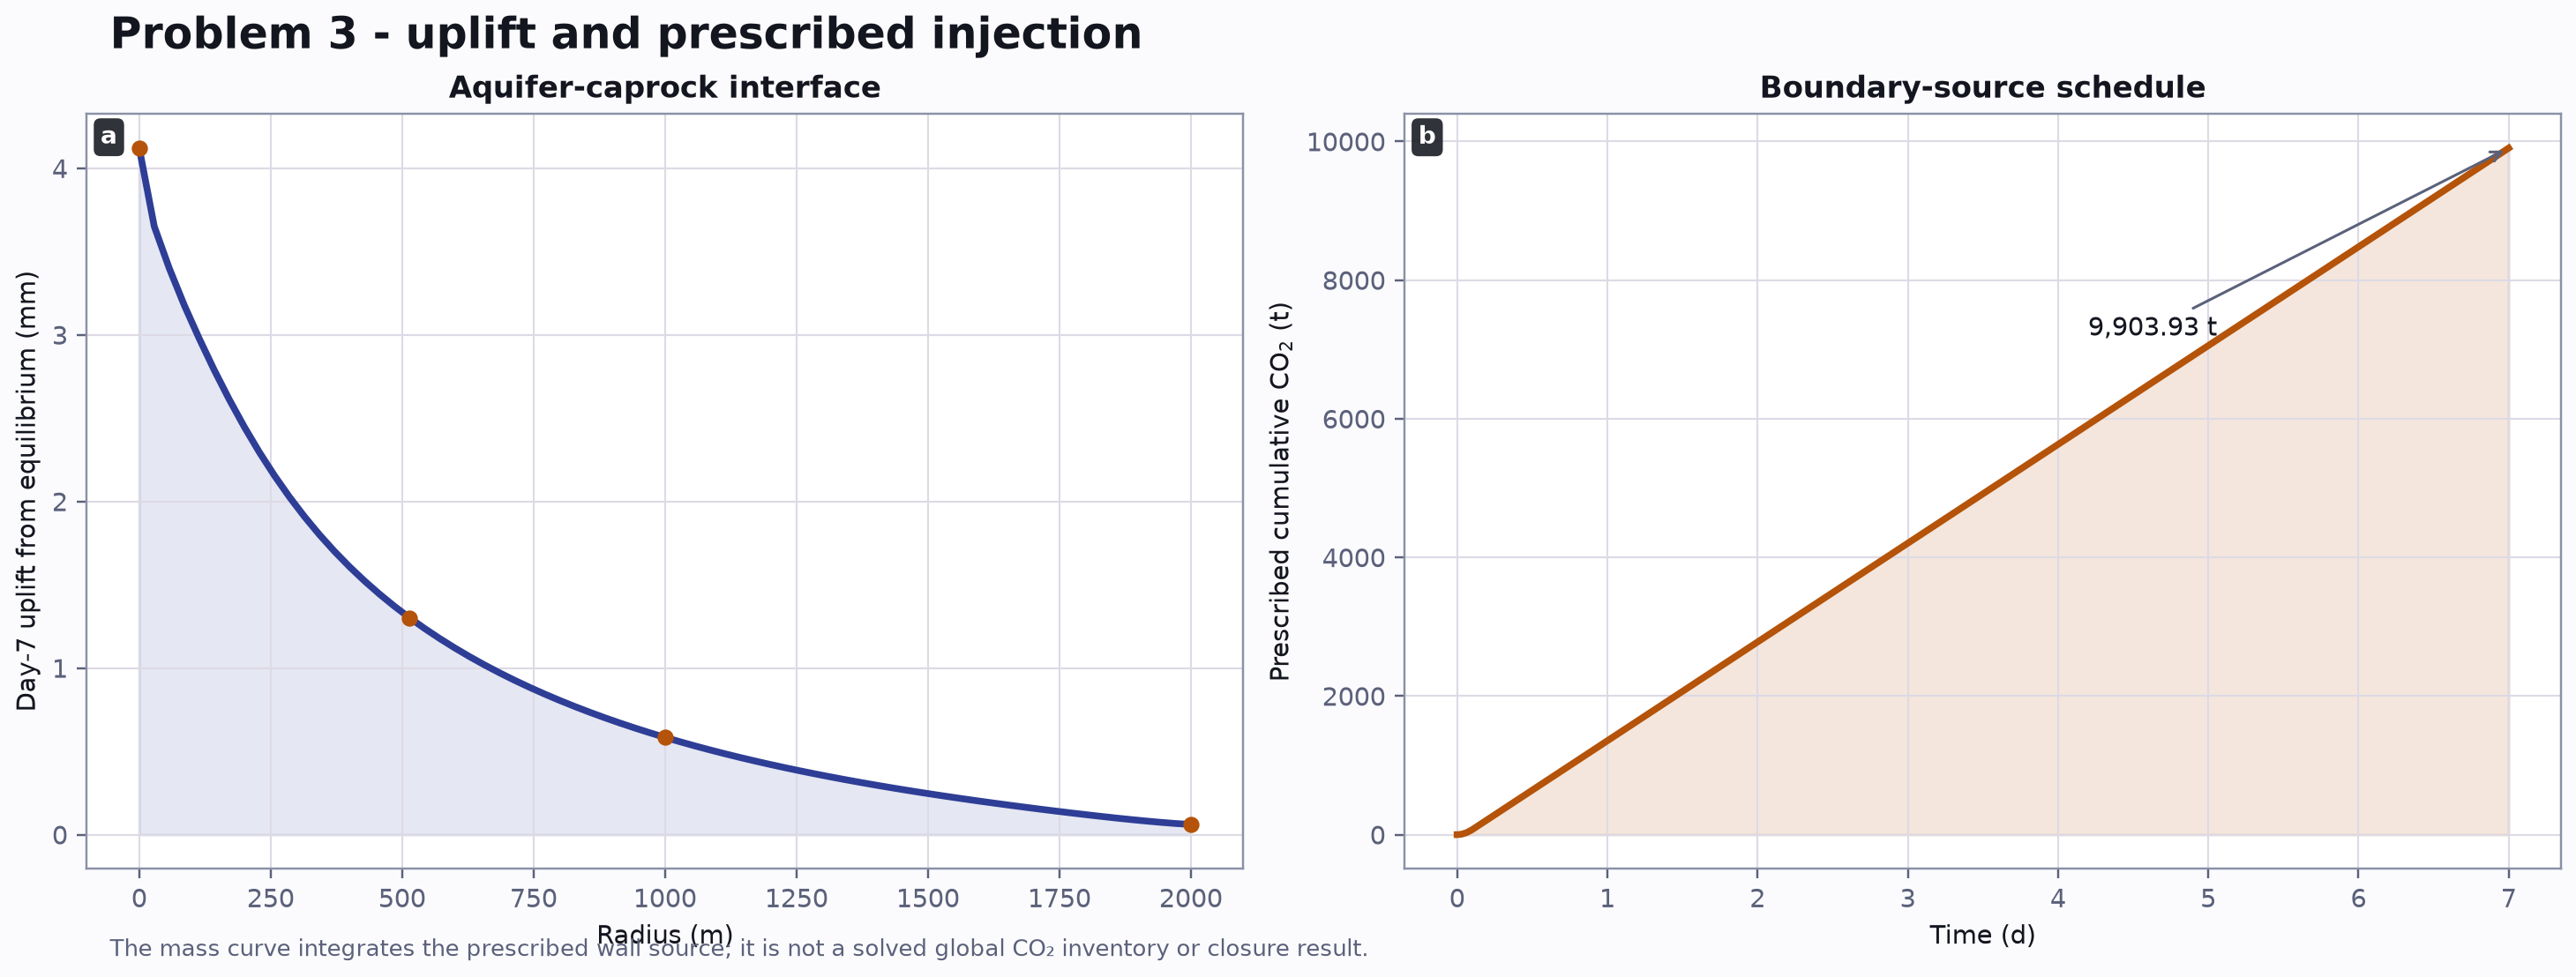
Pressure build-up expands the porous skeleton and lifts the aquifer-caprock interface.
Near the well, gas pressure reaches 17.3362 MPa, liquid pressure reaches 17.3134 MPa, and the minimum liquid saturation is 0.626713. Volumetric response changes porosity in both the aquifer and the lower-permeability caprock.
The equilibrium-relative uplift is 4.12072 mm at r = 0.15 m, 1.30126 mm at 514.397 m, 0.58368 mm near 1,000 m, and 0.06099 mm at 2,000 m. The response decays smoothly with radial distance.
Reference: CODE_BRIGHT Tutorial manual (2026).
The three solved models open in Terra with their geometry, physics, mesh, study, and result definitions preserved.
Request technical access